Oren Eini

CEO of RavenDB

a NoSQL Open Source Document Database

Get in touch with me:

oren@ravendb.net +972 52-548-6969

Posts: 7,565
|
Comments: 51,184
Privacy Policy · Terms
filter by tags archive
time to read 5 min | 921 words

image One of the things that I am really sensitive for is friction. And anytime that I run into that, I am doing an evaluation about how much it is going to cost to remove that. Thee are two sides for this evaluation. There is the pure monetary/time side, and then there is the pure opportunities lost side.

The usual evaluation is “it takes 3 minutes to do so manually, and would take a week to resolve in an automatic way”, assuming a standard 40 hours week, we would need to do something for 800 times before it make sense resolve that automatically.

The problem is ignoring the opportunities lost angle. One of the things that most people do not usually consider is that we tend to avoid things that are painful.

If adding content to a website requires you to commit changes to SVN and then log in to a server and update the site, that is about 3 additional minutes that you topped to something that is probably pretty minor. If you are on a slow connection, those can be pretty frustrating 3 minutes. That means that editing the site get batched, so a lot of minor edits are bundled together, until the 3 minutes overhead become insignificant. That means that the site gets updated less often.

If maintaining two profiles of the same application requires that you would merge between slightly different branches (a pretty painful process), they are not going to be in sync. Building a way which allows a single codebase development for multiple profiles is a pretty significant investment, on the other hand. And it introduce complexity into the software.

If committing is going to hit a network resource (and thus take a bit longer), you are going to commit less often. If branching… but you get the point, don’t you?

If releasing your software is a manual process (even to the point of just promoting a CI build to release status), you aren’t going to release very often.

Those are just a few recent examples that I have run to where friction was the deciding factor. In all cases, I put in the time to reduce the friction to the lowest possible level. What I usually look for is the opportunities lost cost, because those tend to be pretty significant.

image I don’t think about releasing the profiler versions, and I released 20 times in the last three days (5 different builds, times 4 different profiles). The build process for the profiler had me write several custom tools (including my own bloody CI server, for crying out load, a daily build site, upload and registration tools, etc). That decision has justified itself a hundred times over, by ensuring that my work isn’t being hampered by release management, and it a very rapid turn around for releases.

That, in turn, means that we get a lot more confidence from customers (we had a problem and it was resolved in 2 hours). There is actually a separate problem here, that we release too often, but I consider that a better alternative than slow response times for customers.

Supporting Linq to Sql as a second target in NH Prof was something that we could do in three days flat. In practice, it took over a month to get to a position where we could properly release it. The time difference was dedicated to doing it right. And no, I am not talking about architectural beauty, or any such thing.

The three days target time for Linq to SQL implies branching the code base and simply making the changes inline. There is relatively very little change from the NH Prof version, and we could just make it all work in a short amount of time.

I am talking about doing it in a way that introduce no additional friction to our work. Right now I am supporting 4 different profiles (NHibernate, Hibernate, Linq to SQL, Entity Framework), and in my wild dreams I am thinking of having 10 or more(!). Frictionless processes means that the additional cost of support each new profile is vastly reduced.

Having different branches for different profiles was considered and almost immediately rejected, it would introduce too much friction, confusion and pain into the development process. Instead, we went with the route on having a single code base that is being branched automatically by the build process. It means that we have a slightly more complex infrastructure, but it also means that we can do it once and touch it only very rarely.

Does it pay off? I would say it does just in terms of not having to consider merging between the different branches whenever I make a change or a bug fix. But it is more than that.

A week ago I didn’t have the Entity Framework Profiler, today it is in a private beta, and in a week or two it is going to go to public beta. All that time spent on integrating Linq to SQL paid itself off when we could just plug in a new profile without really thinking about it.

time to read 1 min | 127 words

Well, here is a new thingie, L2SProf can now detect transactions.

Both standard SQL transactions:

image

And also distributed transactions using System.Transactions:

image

This is an interesting feature, because you can see how the use of different transaction strategies have a big impact on how you structure your code.

For example, with L2S, it seems like you are encouraged to read outside of a transaction. Something that I, as an NHibernate user, find quite odd.

time to read 7 min | 1382 words

I have run into WPF memory leaks before, and I thought that I fixed them all, but I started getting more reports from people experiencing large memory usage from NH Prof. That lead me to try to track it down again.

Short story, you can get the reproduction here: http://github.com/ayende/wpf-mem-leak

I left an NH Prof instance running overnight, and was able to confirm that there is a memory leak in there, just by seeing how much more memory it had in task manager. One of the nicest things in Windows 7 is the ability to generate a dump directly from task manager.

I loaded that dump into windbg, loaded sos and mscrowks and set out to figure out what was taking so much memory. The most common way to start a memory leak issue is to start figuring out what is taking all this memory.  For that, the !dumpheap –stat command is great, since it give you memory usage by type and size. Here is what I found:

000007fee95b8a88   364674     11669568 MS.Utility.SingleItemList`1[[System.WeakReference, mscorlib]]
000007feeffe4748    51074     13161552 System.Object[]
000007fee77417a8   728189     17476536 MS.Internal.Data.ValueChangedEventArgs
000007fee95aafe8   364133     17478384 MS.Utility.ThreeItemList`1[[System.WeakReference, mscorlib]]
000007fee95b88c0   728814     17491536 MS.Utility.FrugalObjectList`1[[System.WeakReference, mscorlib]]
000007fee95b8838   728814     23322048 System.Windows.WeakEventManager+ListenerList
0000000000496170    19063     28004120      Free
000007fee7741730   728189     40778584 MS.Internal.Data.ValueChangedEventManager+ValueChangedRecord
000007fef0036c90   736210     47117440 System.EventHandler
000007feeffe7a90  1837702     58806464 System.WeakReference

I literally groaned when I saw that, based on my previous experience, it means that the memory leak is generated from inside WPF code, and that I am not likely to fix it. Then I set out to figure out where it is at. My suspicion fell on the statistics feature, it is the only thing that really updates frequently, after all.

So I setup to build a reproduction. Sadly, it is trivially easy to reproduce the issue. Given this XAML:

<StackPanel>
<ItemsControl ItemsSource="{Binding Path=Statistics}">
<ItemsControl.ItemTemplate>
<DataTemplate>
<Border Padding="2 0 0 0">
<Grid>
<Grid.ColumnDefinitions>
<ColumnDefinition Width="160"/>
<ColumnDefinition Width="Auto" />
<ColumnDefinition Width="*" />
</Grid.ColumnDefinitions>
<TextBlock Text="{Binding Path=Key}"
ToolTip="{Binding Path=Key}"
TextTrimming="CharacterEllipsis" />
<GridSplitter Grid.Column="1"
Background="#3000"
Width="2"
Margin="2 0" />
<TextBlock Text="{Binding Path=Value}"
Grid.Column="2" />
</Grid>
</Border>
</DataTemplate>
</ItemsControl.ItemTemplate>
</ItemsControl>
</StackPanel>

The following code will generate a memory leak:

public partial class Window1 : Window
{
readonly DispatcherTimer timer = new DispatcherTimer(DispatcherPriority.Normal)
{
Interval = TimeSpan.FromMilliseconds(1)
};

private readonly MyModel context;

public Window1()
{
InitializeComponent();
context = new MyModel();
context.UpdateData();
timer.Tick += (sender, args) => context.UpdateData();
DataContext = context;
timer.Start();
}

public class MyModel
{
public ObservableCollection<DictionaryEntry> Statistics { get; set; }

public MyModel()
{
Statistics = new ObservableCollection<DictionaryEntry>();
}

public void UpdateData()
{
Statistics.Clear();
Statistics.Add(new DictionaryEntry("Time", DateTime.Now.ToString()));
Statistics.Add(new DictionaryEntry("Mem", GC.GetTotalMemory(true).ToString("#,#")));
}
}
}

When you run the code, you can see that memory usage is going up all the time. As far as I can tell, I am not doing anything that is wrong or even slightly strange here. You can get the reproduction here: http://github.com/ayende/wpf-mem-leak

I tried several workarounds so far, but I didn’t like any of them. Any ideas?

time to read 1 min | 98 words

There are still available places for my 3 days course about NHibernate in Aarhus on December 9th.

This course is aimed at developers who are new to NHibernate or those who want to amp up their NHibernate knowledge. In the course, we go over mapping options, queries and optimizations, caching, extensibility options and a whole lot more.

I gave this course several times already, and it is pretty intense, but at the end of it, you are going to come out knowing NHibernate.

You can register to the course here:

http://skillsmatter.com/course/open-source-dot-net/core-persistence-with-nhibernate

time to read 2 min | 310 words

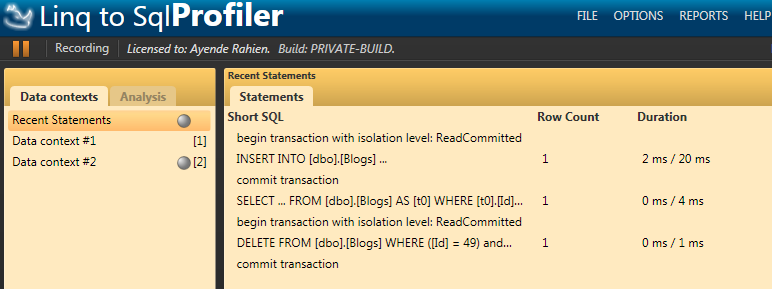
I really want to be able to provide duration & row count for Linq to Sql. It has became a personal goal of mine.

The problem is that there is absolutely no open extensibility points within L2S that would allow it. The solution is… to  break down the wall. If you don’t have extensibility points, then I will make some.

image

And, you know what? I did:

image

The problem is that it took almost 12 hours to get it to this point, and along the way I had to build a new provider for Linq to Sql. And yes, that is not possible. Not isn’t supposed to be possible, just is not possible.

To get this to work I had to build a hack on top of a crack on top of a very angry duck.

image

I have been working on this for the last 12 hours, and this is about the most unsupported method that you could find to hook into things (I had to break the CLR type system to get this to work, and the things that I do with reflection are probably amoral in at least three different religions).

The problem with going with that route is that now I have to delay the public beta for L2S Prof. The good thing is that I can now provide additional information about Linq to SQL.

time to read 1 min | 157 words

I mentioned before that exporting reports (so you can mail them around) is something that I would really like to do. In fact, I decided to put it out as a challenge, and I got some really great responses.

Josh Perry has been able to flat out amaze me with a solution that was at once simple, elegant and beautiful. It is an HTML report that contains all the styling inline (so it supports emailing it around, for example, to the DBA) but it also has some java script smarts around it that make it behave like the real application.

As a matter of fact, I have added the exported version as a “live demo” for NH Prof.

I am quite happy with this. You can export your NH Prof load using File > Export, giving you a single HTML that is easily achievable, mailable, etc.

 Check it out.

time to read 3 min | 431 words

So, I have to do a lot of L2S and EF work recently, while trying to create L2SProf and EFProf. The interesting tidbit is that I got a totally different approach to using them than almost anyone else.

I don’t really care for either as an OR/M (I have my own, thank you very much), I only care for plugging into them deeply enough that I can get the information that I want.

With L2S, that was fairly easy, all I needed to do was figure out how to get access to the logging that it was already doing, and I was pretty much done. With EF, there isn’t any logging, and I was left having to write my own EF provider (and then plugging that in). I am going to talk about how I plugged myself into EF at some length some other time.

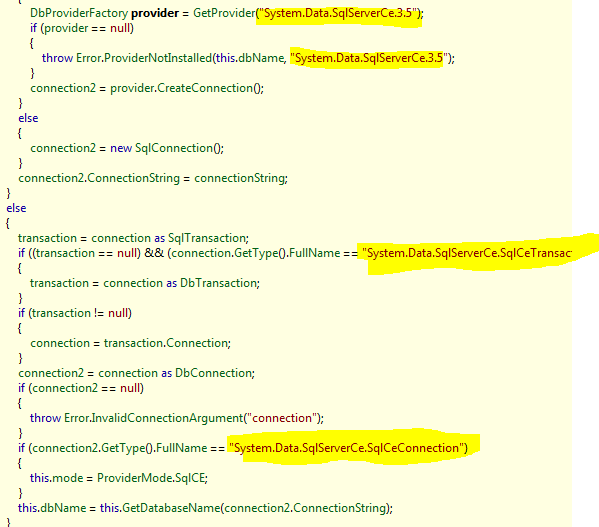
One of the most frustrating things with L2S is while the initial implementation was significantly easier than EF, it doesn’t take very long to hit a hard wall of internal stuff. What is worse, it is pretty obvious that there was some pretty sweet architecture inside that got totally killed for non technical reasons. Sometimes, I feel like a code archeologist. I mean, take a look at SqlProvider.Initialize() in reflector for a second:

image

I am willing to bet that this stuff was added after the decision to kill the L2S provider model was added. This kind of stuff really need to be in a separate provider, but that would have forced IProvider to be public, so it was hacked around.

With the EF version, there are absolutely no visibility into what EF is doing (by that I mean logging, tracing, etc). It does have extensibility in it, however, which means that I could plug into that and then replace enough things until I had the hooks in place to provide the information that I needed. This isn’t that much fun, I’ll admit, but it is working for me so far.

The initial leap to get EF profiling working is much harder, but once that is done, it is pretty straightforward to get most of the stuff that I need. L2S basic architecture make the first few steps very easy, but then you get into a maze of blocked internal stuff.

The more I work on this, the more I like this blog’s tagline.

time to read 2 min | 250 words

One of the things that I would like to do with L2S Prof is to figure out how to detect row counts and query duration. The problem is that there is absolutely no way of doing that at the Linq to SQL level.

So one of the things that I have been researching is trying to get to the tracing that are present at the System.Data.SqlClient level. For more information about those, you can read this article, which explains them in depth. Basically, Windows comes with a really good support for optional tracing, and System.Data.SqlClient makes use of that in order to trace out a lot of information, including what I would need in order to provide row counts and query duration.

The problem?

Enabling this support is a very invasive process, requiring multiple steps and affecting the entire machine. What I would really like to do is to find some way of tracing those events by flipping a switch inside the application that I am running, and then gathering the interesting stuff inside the same application. I don’t want to muck around with machine global settings.

Right now, I don’t see any way of doing that, so I think that I am going to leave it as that for now.

If anyone can point me to how to do it, I’ll add those capabilities to L2S Prof, but until that happens, I am afraid they aren’t going to be there :-(

time to read 1 min | 186 words

image

Well, after talking about it quite often recently, I think it is just about time to make this public.

The Linq to Sql Profiler is now on public beta, and it is even more awesome than you could imagine.

We are able to get a tremendous amount of information out of Linq to Sql, so from profiling behavior it is quite on par with NH Prof or Hibernate Profiler.

Here is a screen shot:

image

Please note that the UI color scheme is still under development, we would love to hear feedback about that as well.

Like NH Prof, L2S Prof is currently offered in a 30% discount for the duration of the beta period.

Looking forward for your feedback…

time to read 2 min | 373 words

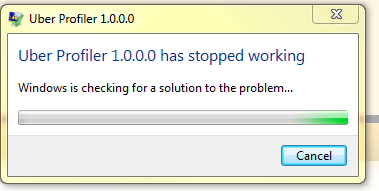
One of the things that happened when I pushed the UberProf build of NH Prof out is that people started complaining that trying to load a saved snapshot would crash the application. It took me a while to reproduce that, but I finally manage to get this:

image

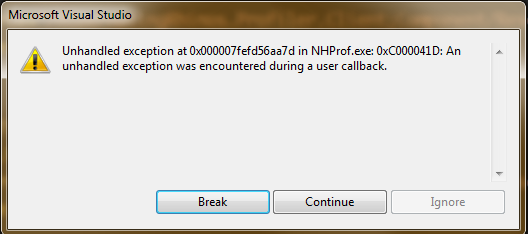
When I tried to debug it, all I got was this, and native stack trace that I had no way of actually resolving.

image

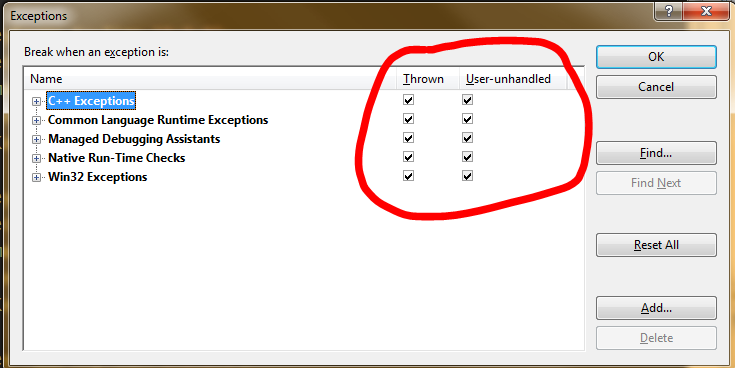
Trying to reproduce the problem in the debugger resulted in the same experience. I tried playing around with WinDbg for a while, but I am not very good at that, so I gave up and tried something that I find useful in the past. Tell Visual Studio that I want it to capture all types of exceptions, not just CLR exceptions:

image

Using this mode, I managed to get:

image

This led me to inspect the CancellableWaitBoxView.xaml, which contains:

image

And now it all made sense. With the UberProf builds, each profiler has a distinct assembly name. The problem is that this XAML refer to the master assembly name (which I use for development). 

The reason this issue was hard to fix was that it is WPF window failing, and then somehow that exception is being swallowed and translated into a native error dialog, I am not quite sure why. Once I knew what the problem was, the fix was quite simple (using assembly resolve).

FUTURE POSTS

No future posts left, oh my!

RECENT SERIES

  1. Production Postmortem (52):
    07 Apr 2025 - The race condition in the interlock
  2. RavenDB (13):
    02 Apr 2025 - .NET Aspire integration
  3. RavenDB 7.1 (6):
    18 Mar 2025 - One IO Ring to rule them all
  4. RavenDB 7.0 Released (4):
    07 Mar 2025 - Moving to NLog
  5. Challenge (77):
    03 Feb 2025 - Giving file system developer ulcer
View all series

RECENT COMMENTS

Syndication

Main feed Feed Stats
Comments feed   Comments Feed Stats
}