Oren Eini

CEO of RavenDB

a NoSQL Open Source Document Database

Get in touch with me:

oren@ravendb.net +972 52-548-6969

Posts: 7,583
|
Comments: 51,214
Privacy Policy · Terms
filter by tags archive
time to read 4 min | 653 words

RavenDB is written in C#, and as such, uses managed memory. As a database, however, we need granular control of our memory, so we also do manual memory management.

One of the key optimizations that we utilize to reduce the amount of overhead we have on managing our memory is using an arena allocator. That is a piece of memory that we allocate in one shot from the operating system and operate on. Once a particular task is done, we can discard that whole segment in one shot, rather than try to work out exactly what is going on there. That gives us a proper scope for operations, which means that missing a free in some cases isn’t the end of the world.

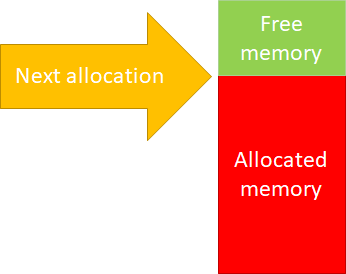
It also makes the code for RavenDB memory allocation super simple. Here is what this looks like:

image

Whenever we need to allocate more memory, we’ll just bump the allocator up. Initially, we didn’t even implement freeing memory, but it turns out that there are a lot of long running processes inside of RavenDB, so we needed to reuse the memory inside the same operation, not just between operations.

The implementation of freeing memory is pretty simple, as well. If we return the last item that we allocated, we can just drop the next allocation position by how many bytes were allocated. For that matter, it also allows us to do incremental allocations. We can ask for some memory, then increase the allocation amount on the fly very easily.

Here is a (highly simplified) example of how this works:

As you can see, there isn’t much there. A key requirement here is that you need to return the memory back in the reverse order of how you allocated it. That is usually how it goes, but what if it doesn’t happen?

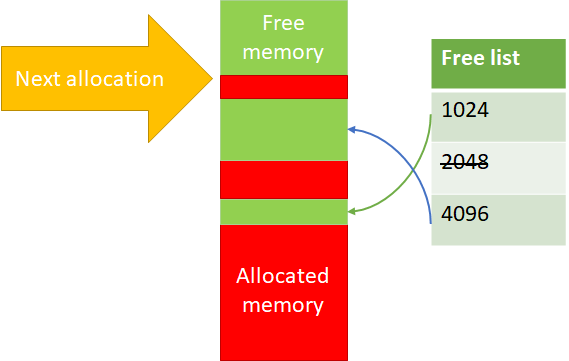
Well, then we can’t reuse the memory directly. Instead, we’ll place them in a free list. The actual allocations are done on powers of two, so that makes things easier. Here is what this actually looks like:

image

So if we free, but not from the top, we remember the location and can use it again. Note that for 2048 in the image above, we don’t have any free items.

I’m quite fond of this approach, since this is simple, easy to understand and has a great performance profile.  But I wouldn’t be writing this blog post if we didn’t run into issues, now would I?

A customer reported high memory usage (to the point of memory exhaustion) when doing a certain set of operations. That… didn’t make any sense, to be honest. That was a well traveled code path, any issue there should have been long found out.

They were able to send us a reproduction and the support team was able to figure out what is going on. The problem was that the code in question did a couple of things, which altogether led to an interesting issue.

  • It allocated and deallocated memory, but not always in the same order – this is fine, that is why we have the free list, after all.
  • It extended the memory allocation it used on the fly – perfectly fine and an important optimization for us.

Give it a moment to consider how could these two operations together result in a problem…

Here is the sequence of events:

  • Loop:
    • Allocate(1024) -> $1
    • Allocate(256) -> $2
    • Grow($1, 4096) -> Success
    • Allocate(128) -> $3
    • Free($1) (4096)
    • Free($3) (128)
    • Free($2) (256)

What is going on here?

Well, the issue is that we are allocating a 1KB buffer, but return a 4KB buffer. That means that we add the returned buffer to the 4KB free list, but we cannot pull from that free list on allocation.

Once found, it was an easy thing to do (detect this state and handle it), but until we figured it out, it was quite a mystery.

time to read 3 min | 595 words

RavenDB introduced a TCP compression feature in version 5.3. The idea is that all internal communication in the cluster (as well as subscriptions), will use the Zstd compression format to reduce the overall bandwidth utilization by RavenDB. We have always supported HTTP compression, and that closed the circle.

The fact hat we are using Zstd means that we have a higher compression ratio and less CPU usage, so everyone was happy.  Except… sometimes, they weren’t.

In some cases, we noticed that there would be network failures at a far higher rate than previous experienced. RavenDB is robust to network errors, so that was handled, but that is still a concern. We figured out that the problem was rooted in the compression code. If we enabled compression between the systems, it would have far higher rate of failures than otherwise. But only when running in secured mode, when the system is running without security, everything works.

My first suspicion is that something is in the network, monitoring it. But the whole point of secured mode is that no one can peek into the stream not interfere with the contents. Given that this is a self-healing issue, it took some time to dedicate the right amount of attention to it, but we managed to figure it out.

This is a confluence of three different features that all play together to get this to happen.

With compression, we typically do something like this:

That is pretty much how all compression stream will work. But we do have to consider the following issue, there may be no output.

When can that happen?

Let’s assume that I’m using the simplest compression algorithm (run length encoding).

In other words, it will take a buffer such as: aaaaaacccccccbbbb and turn that into a7c6b4.

Now, let’s consider what would be the output of such an algorithm if we pass it a buffer consisting of a single value?

It will only update its internal state, it will not output anything. That is fine, we need a call to Flush() to ensure that all the state is out.

That means that this will return an empty buffer, which we are then writing to the inner stream. And that is fine, right? Since writing a zero length buffer is a no-op.

Except that it isn’t a no-op. There is the concept of empty SSL records, mostly it seams to handle the BEAST attack. So when you pass an empty buffer to the SslStream, it will emit an empty record to the network.

Which is good, except that you may have a scenario where you emit a lot of those values. And it turns out that OpenSSL has a limit to how many consecutive empty records it will accept (under the assumption that it must move forward and produce output and not just loop).

So, in order to repeat this bug, we need:

  • Input that will result in zero output from the compressor (fully repeating previous values, usually). Resulting in a zero length buffer as the output of the compression.
  • Sending the empty SSL record over the stream.
  • Repeating this for 32 times.

When all three conditions are satisfied, we get an error on the receiving end and the connection is broken. That means that the next call will have a different compression state and likely won’t have a problem at the same location.

In short, this is fun exercise in seeing how three different design decisions, all of whom are eminently reasonable, result in a very hard to trace bug.

The good thing is that this is simplicity itself to solve. We just need to avoid writing zero length buffer to the stream.

time to read 4 min | 641 words

We got a call from a customer, a pretty serious one. RavenDB is used to compute billing charges for customers. The problem was that in one of their instances, the value for a particular customer was wrong. What was worse was that it was wrong on just one instance of the cluster. So the customer would see different values in different locations. We take such things very seriously, so we started an investigation.

Let me walk you through reproducing this issue, we have three collections (Users, Credits and Charges):

image

The user is performing actions in the system, which issue charges. This is balanced by the Credits in the system for the user (payment they made). There is no 1:1 mapping between charges and credits, usually.

Here is an example of the data:

image

And now, let’s look at the index in question:

This is a multi map-reduce index that aggregates data from all three collections. Now, let’s run a query:

image

This is… wrong. The charges & credits should be more or less aligned. What is going on?

RavenDB has a feature called Map Reduce Visualizer, to help work with such scenarios, let’s see what this tells us, shall we?

image

What do we see in this image?

You can see that we have two results for the index. Look at Page #854 (at the top), we have one result with –67,343 and another with +67,329. The second result also does not have an Id property or a Name property.

What is going on?

It is important to understand that the image that we have here represents the physical layout of the data on disk. We run the maps of the documents, and then we run the reduce on each page individually, and sum them up again. This approach allows us to handle even a vast amount of data with ease.

Look at what we have in Page #540. We have two types of documents there, the users/ayende document and the charges documents. Indeed, at the top of Page #540 we can see the result of reducing all the results in the page. The data looks correct.

However…

Look at Page #865, what is going on there? Looks like we have most of the credits there. Most importantly, we don’t have the users/ayende document there. Let’s take a look at the reduce definition we have:

What would happen when we execute it on the results in Page #865? Well, there is no entry with the Name property there. So there is no Name, but there is also no Id. But we project this out to the next stage.

When we are going to reduce the data again among all the entries in Page #854 (the root one), we’ll group by the Id property, but the Id property from the different pages is different. So we get two separate results here.

The issue is that the reduce function isn’t recursive, it assumes that in all invocations, it will have a document with the Name property. That isn’t valid, since RavenDB is free to shuffle the deck in the reduce process. The index should be robust to reducing the data multiple times.

Indeed, that is why we had different outputs on different nodes, since we don’t guarantee that will process results in the same order, only that the output should be identical, if the reduce function is correct. Here is the fixed version:

And the query is now showing the correct results:

image

That is much better Smile

time to read 3 min | 415 words

A customer called us, complaining that RavenDB isn’t supporting internationalization. That was a big term to unpack. It boiled down to a simple issue. They were using Hebrew text in their system, consuming us from a node.js client, and they observed that sometimes, RavenDB would corrupt the data.

They would get JSON similar to this:

{ “Status”: "�", “Logged: true }

That… is not good. And also quite strange. I’m a native Hebrew speaker, so I threw a lot of such texts into RavenDB in the past. In fact, one of our employees built a library project for biblical texts, naturally all in Hebrew. Another employee maintained a set of Lucene analyzers for Hebrew. I think that I can safely say that RavenDB and Hebrew has been done. But the problem persisted. What was worse, it was not consistent. Every time that we tried to see what is going on, it worked.

We added code inside of RavenDB to try to detect what is going on, and there was nothing there. Eventually we tried to look into the Node.js RavenDB client, because we exhausted everything else. It looked okay, and in our tests, it… worked.

So we sat down and thought about what it could be. Let’s consider the actual scenario we have on hand:

  • Hebrew characters in JSON are being corrupted.
  • RavenDB uses UTF-8 encoding exclusively.
  • That means that Hebrew characters are using multi byte characters

That line of thinking led me to consider that the problem is related to chunking. We read from the network in chunks, and if the chunk happened to fall on a character boundary, we mess it up, maybe?

Once I started looking into this, the fix was obvious:

image

Here we go: ‍!

This bug is a great example of how things can not show up in practice for a really long time. In order to hit this you need chunking to happen in just the wrong place, and if you are running locally (as we usually do when troubleshooting), the likelihood you’ll see this is far lower. Given that most JSON property names and values are in the ASCII set, you need a chunk of just the right size to see it. Once we know about it, reproducing it is easy, just create a single string that is full of multi byte chars (such as an emoji) and make it long enough that it must be chunked.

The fix was already merged and released.

time to read 3 min | 470 words

A customer opened a support call telling us that they reached the scaling limits of RavenDB. Given that they had a pretty big machine specifically to handle the load they were expecting, they were (rightly) upset about that.

A short back and forth caused us to realize that RavenDB started to fail shortly after they added a new customer to their system. And by fail I mean that it started throwing OutOfMemoryException in certain places. The system was not loaded and there weren’t any other indications of high load. The system had plenty of memory available, but critical functions inside RavenDB would fail because of out of memory errors.

We looked at the actual error and found this log message:

Raven.Client.Exceptions.Database.DatabaseLoadFailureException: Failed to start database orders-21
At /data/global/ravenData/Databases/orders-21
 ---> System.OutOfMemoryException: Exception of type 'System.OutOfMemoryException' was thrown.
   at System.Threading.Thread.StartInternal(ThreadHandle t, Int32 stackSize, Int32 priority, Char* pThreadName)
   at System.Threading.Thread.StartCore()
   at Raven.Server.Utils.PoolOfThreads.LongRunning(Action`1 action, Object state, String name) in C:\Builds\RavenDB-5.3-Custom\53024\src\Raven.Server\Utils\PoolOfThreads.cs:line 91
   at Raven.Server.Documents.TransactionOperationsMerger.Start() in C:\Builds\RavenDB-5.3-Custom\53024\src\Raven.Server\Documents\TransactionOperationsMerger.cs:line 76
   at Raven.Server.Documents.DocumentDatabase.Initialize(InitializeOptions options, Nullable`1 wakeup) in C:\Builds\RavenDB-5.3-Custom\53024\src\Raven.Server\Documents\DocumentDatabase.cs:line 388
   at Raven.Server.Documents.DatabasesLandlord.CreateDocumentsStorage(StringSegment databaseName, RavenConfiguration config, Nullable`1 wakeup) in C:\Builds\RavenDB-5.3-Custom\53024\src\Raven.Server\Documents\DatabasesLandlord.cs:line 826 

This is quite an interesting error. To start with, this is us failing to load a database, because we couldn’t spawn the relevant thread to handle transaction merging. That is bad, but why?

It turns out that .NET will only consider a single failure scenario for a thread failing to start. If it fails, it must be because the system is out of memory. However, we are running on Linux, and there are other reasons why that can happen. In particular, there are various limits that you can set on your environment that would limit the number of threads that you can set.

There are global knobs that you should look at first, such as those:

  • /proc/sys/kernel/threads-max
  • /proc/sys/kernel/pid_max
  • /proc/sys/vm/max_map_count

Any of those can serve as a limit. There are also ways to set those limits on a per process manner.

There is also a per user setting, which is controlled via:

/etc/systemd/logind.conf: UserTasksMax

The easiest way to figure out what is going on is to look at the kernel log at that time, here is what we got in the log:

a-orders-srv kernel: cgroup: fork rejected by pids controller in /system.slice/ravendb.service

That made it obvious where the problem was, in the ravendb.service file, we didn’t have TasksMax set, which meant that it was set to 4915 (probably automatically set by the system depending on some heuristic).

When the number of databases and operations on the database reached a particular size, we hit the limit and started failing. That is not a fun place to be in, but at least it is easy to fix.

I created this post specifically so it will be easy to Google that in the future. I also created an issue to get a better error message in this scenario.

time to read 6 min | 1044 words

imageA customer called us with an interesting issue. They have a decently large database (around 750GB or so) that they want to replicate to another node. They did all the usual things that you need to do and the process started running as expected. However… that wouldn’t make for an interesting postmortem post if everything actually went right…

Their problem was that the replication stalled midway through. There were no resource limits, but the replication didn’t progress even though the network traffic was high. So something was going on, but it didn’t move the replication for some reason.

We first ruled out the usual suspects (replication issue causing a loop, bad network, etc) and we were left scratching our heads. Everything seemed to be fine, the replication was working, but at a rate of about 1 – 2 documents a minute. In almost 12 hours since the replication started, only about 15GB were replicated to the other side. That was way outside expectations, we assumed that the whole replication wouldn’t take this long.

It turns out that the numbers we got were a lie. Not because the customer misled us, but because RavenDB does some smarts behind the scenes that end up being pretty hard on us down the road. To get the full picture, we need to understand exactly what we have in the customer’s database.

Let’s say that you store data about Players in a game. Each player has a bunch of stats, characters, etc. Whenever a player gets an achievement, the game will store a screenshot of the achievement. This isn’t the actual scenario, but it should make it clear what is going on. As players play the game, they earn achievements. The screenshots are stored as attachments inside of RavenDB. That means that for about 8 million players, we have about 72 million attachments or so.

That explains the size of the database, of course, but not why we aren’t making progress in the replication process. Digging deeper, it turns out that most of the achievements are common across players (naturally), and that in many cases, the screenshots that you store in RavenDB are also identical.

What happens when you store the same attachment multiple times in RavenDB? Well, there is no point in storing it twice, RavenDB does transparent de-duplication behind the scenes and only stores the attachment’s data once. Attachments are de-duplicated based on their content, not their name or the associated document. In this scenario, completely accidentally, the customer set up an environment where they would upload a lot of attachments to RavenDB, which are then de-duplicated by RavenDB.

None of that is intentional, it just came out that way. To be honest, I’m pretty proud of that feature, and it certainly helped a lot in this scenario. Most of the disk space for this database was taken by attachments, but only a small number of the attachments are actually unique. Let’s do some math, then.

Total attachments' size is: 700GB. There are about half a million unique attachments. There are a total of 72 million attachments. That means that the average size of an attachment is about 1.4MB or so. And the total size of attachments (without de-duplication) is over 100 TB.

I’ll repeat that again, the actual size of the data is 100 TB. It is just that RavenDB was able to optimize that using de-duplication to have significantly less on disk due to the pattern of data that is stored in the database.

However, that applies at the node level. What happens when we have replication? Well, when we send an attachment to the other side, even if it is de-duplicated on our end, we don’t know if it is on the other side already. So we always send the attachments. In this scenario, where we have so many duplicate attachments, we end up sending way too much data to the other side. The replication process isn’t sending 750GB to the other side but 100 TB of data.

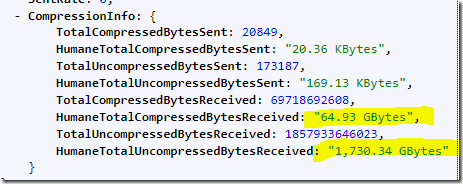
The customer was running RavenDB 5.2 at the time, so the first thing to do when we figured this out was to upgrade to RavenDB 5.3. In RavenDB 5.3 we have implemented TCP compression for internal data (replication, subscription, etc). Here are the results of this change:

image

In other words, we were able to compress the 1.7 TB we sent to under 65 GB. That is a nice improvement. But the situation is still not ideal.

De-duplication over the wire is a pretty tough problem. We don’t know what is the state on the other side, and the cost of asking each time can be pretty high.

Luckily, RavenDB has a relevant feature that we can lean on. RavenDB has to handle a scenario where the following sequence of events occurs (two nodes, A & B, with one way replication happening from A to B):

  • Node A: Create document – users/1
  • Node B: Replication document: users/1
  • Node A: Add attachment to users/1 (also modifies users/1)
  • Node B: Replication of attachment for users/1 & users/1 document
  • Node A: Modify users/1
  • Node B: Replication of users/1 (but not the attachment, it was already sent)
  • Node B: Delete users/1 document (and the associated attachment)
  • Node A: Modify users/1
  • Node B: Replication of users/1 (but not the attachment, it was already sent)
  • Node B is now in trouble, since it has a missing attachment

Note that this sequence of events can happen in a distributed system, and we don’t want to leave “holes” in the system. As such, RavenDB knows to detect this properly. Node B will tell Node A that it is missing an attachment and Node A will send it over.

We can utilize the same approach. RavenDB will now remember the last 16K attachments that it sent in the current connection to a node. If the attachment was already sent, we can skip sending it. But if it is missing on the other side, we fall back to the missing attachment behavior and send it anyway.

In a scenario like the one we face, where we have a lot of duplicated attachments, that can reduce the workload by a significant amount, without having to change the manner in which we replicate data between nodes.

time to read 4 min | 669 words

A customer called us about an elevated I/O load in their system after an upgrade to RavenDB 5.3 from RavenDB 4.2. We looked into that, and we saw a small (but very noticeable) rise that we just could not explain. Those sorts of issues are tough to crack, because there isn’t an error or a smoking gun to get you started.

Instead, we just saw a higher average I/O rate, but what is the reason for that? Maybe it is a seasonal change for the customer, with a higher load during the springtime? Or maybe it is related to a new index that was deployed?

We looked, but there hasn’t been anything that should cause higher I/O stress for the system that we could see. So we started diving deeper and deeper into the metrics. On Linux, you can check what files are being read or written to (and all of those that we could see represented reasonable values for their load, there wasn’t anything that wasn’t expected). You can also pull the I/O stats by thread, and we could see that the cluster threads were quite busy in terms of I/O, but that is a big cluster, with plenty of databases and cluster operations to manage, it seems reasonable.

What is going on? I just checked, and the timeline for this investigation is about four weeks, we tried a lot of things to figure it out. But we couldn’t find a smoking gun.

Separately, we got a few bug reports from the field about a cluster issue, sometimes the cluster connection between nodes would break for no reason. The connectivity was good, so there was no reason for the break. This is a transient (and expected) error, which RavenDB will gracefully recover from. But it was a new behavior, so we looked into that.

It turns out that during some refactoring, we moved a piece of code in such a way that under certain conditions, it would read too much from the buffer, but not consume all of it. Basically, this issue came back in some cases. In order to trigger this problem, we had to have a very specific network configuration with exact latencies compared to the CPU load on the server. When that behavior was triggered, we would discard some part of the message from the other side. In some cases, that just meant that we skipped an update (in a stream of them), no big deal, we’ll get the next one successfully. But depending on the size of the cluster in question and the latencies involved, we may get corrupted data (since we are missing the data). We properly detect and abort the connection in this case.

It turns out that when such a thing happens, RavenDB considers the other side to have failed, and the cluster takes the appropriate action to compensate. That means that it will re-assign the tasks across the cluster. A few seconds later, the connection would be resumed, the cluster would realize that the node is “up” again and move the tasks back to the node.

Those tasks include things like subscriptions, ETL processes, external replication, etc.

In other words, under a specific set of conditions, we’ll have a lot of jitters, for lack of a better term in the cluster. Some of the nodes will be moved in and out of rehab (a status that means that they aren’t fully functional). That led, in turn, to a high churn of tasks (and each of those has its own I/O costs).

There are other factors here, naturally, such as higher CPU and memory, but I/O is where we are typically most constrained, so it showed up there mostly. The bug was fixed (and it is in the latest stable) and we have confirmation from the customer that this indeed resolved their issue.

It just goes to show how complex systems are. A bug occurs on node A when reading from the network under specific latencies conditions has cascaded to a higher resource utilization on node C. Butterfly effect indeed.

time to read 3 min | 592 words

A customer called the support hotline with a serious problem. They had a large database and wanted to add another replica node to it. This is a fairly standard thing to do, of course. The problem was that somewhere around the 70% mark, the replication process stalled. All the metrics were green, the mentor node and the new node had perfect connectivity, and there were no errors in the logs.

Typical reasons for replication to stall usually involve connectivity issues, but in this case, we could see that there was no such sign of that. In fact, the mentor node kept sending (empty) batches to the destination node. That shouldn’t be the case, however. If we have nothing to send, there shouldn’t be a batch sent over the wire. That was the only hint of something wrong.

We also looked into what information RavenDB could tell us about the system, and noticed that we have a performance hint about big documents. Some of them exceeded 32MB in size, which is… quite a lot.  That doesn’t really relate so much to replication, however. It would surely slow it down, but it should work.

Looking into the logs, we could see that the mentor node was attempting to send a batch, but it was sending zero documents. Digging deeper, we saw an entry about skipping documents, that was… strange. Cross referencing the log statement with the source code revealed that RavenDB decided that it is sending too much in the batch and aborted it. But… it isn’t sending anything in the batch.

What is actually going on is that the database in question is an encrypted one. Encrypted databases in RavenDB are encrypted in both disk and memory. The only time that we decrypt a document is when there is an active transaction reading it. During that time, we hold that in locked memory (so it wouldn’t be paged to disk). As a result of that, we try to limit the size of transactions in encrypted databases. When we replicate data between nodes, we open a read transaction on the source node, read the documents that we need to replicate and send them to the other side.

There is a small caveat here, each node in an encrypted database can use a different encryption key, so we aren’t sending the encrypted data, but the plain text. Of course, the communication itself is encrypted, so nothing can peek into the data in the middle.

By default, we’ll stop a replication batch in an encrypted database after we locked more than 64 MB of memory. A replication batch of 64 MB is plenty big enough, after all. However… we didn’t take into account a scenario where a single document may cause us to consume more than 64 MB in locked memory. And we put the check to close the replication batch very early in the process.

The sequence of operations was then:

  • Start a replication batch
  • Load the first document to send
  • Realize that we locked too much memory and close the batch
  • Send a zero length batch

Rinse and repeat, since we can’t make any forward progress.

The actual solution was to set the “Replication.MaxSizeToSendInMb” configuration option to a higher value, enough to send even the biggest documents the customer has. At that point, there was forward progress again in the system and the replication was completed successfully.

We still consider this a bug, and we’ll fix it so there won’t be a hang in the system, but I’m happy to see that we were able to do a configuration change and get everything up to speed so quickly.

time to read 4 min | 759 words

imageA typical production postmortem story is a tale of daring dives deep into the guts of your system. It is a journey into the intricacies of dependencies between multiple components, the delicate balance of distributed processes that got just the wrong level of alignment to cause some havoc. A production postmortem is a toil of mystery that can last for weeks. This isn’t one of those tales, however. In this one, the entire thing was wrapped up within fifteen minutes. So what was the issue?

The initial premise was pretty straightforward. A customer was running RavenDB in production, but due to their topology, their RavenDB instances are not exposed to the outside world directly. Instead, they route the connection to Azure Web Application Firewall and through Azure Front Door. I have no comment on the actual decision to route through those firewalls. The problem the customer had was that Azure Front Door doesn’t support web-sockets, RavenDB studio makes extensive use of them for a bunch of reasons and there are certain features that are also dependent on them (such as aggressive caching, the Changes() API, etc).

The customer wanted everything to work, and asked if RavenDB can support a long polling method, to avoid the issue entirely.

This is an XY Problem.

There was much confusion to be had, between our support team, yours truly and the technical people of the customer. Here is the issue, the problem the customer experienced is simply not possible. There is absolutely no way that they can run into this issue.

Here is the deal:

  • RavenDB is a secured-by-default database, which assumes that it is always running in a hostile environment.
  • For security, RavenDB uses TLS 1.2 or higher to safeguard the data in transit.
  • For authentication, RavenDB uses mutual authentication for both client & server using X509 certificates.

Take those three together and you’ll realize that the very design of RavenDB forces you to do SSL termination (here I’m using TLS & SSL as interchangeable terms) at the RavenDB process directly. We have to do it in this manner, since otherwise we wouldn’t be able to validate the certificate from the client.

The customer in this case was running in a secured mode, but was completely unable to use web sockets.

Again, that is not possible. Let me explain why.

If RavenDB is the entity that does SSL termination (in this case, doing the cryptographic handshake, authentication, etc) then anything in the middle between RavenDB and the client is dealing with an encrypted stream of bytes that are indistinguishable from random noise.

In other words, there shouldn’t be a way to not support web sockets, since any proxy in the middle shouldn’t be able to tell what the content of the request is.

This design by RavenDB also prevents you from forwarding requests, since the SSL stream must reach to RavenDB directly (as-is). Otherwise, RavenDB will not be able to authenticate the client certificate.

When we looked at the actual server in question, it quickly became apparent what the issue was. The customer was accessing RavenDB using HTTPS, as is proper. However, RavenDB itself was not configured to run in a secured manner. In other words, the client was accessing RavenDB using HTTPS, but the proxies in the middle will then connect to RavenDB itself using HTTP (no security). That means that RavenDB talks to the proxy with no encryption and the proxy is able to see into the requests. That leads, of course, to the situation where the supported feature set of the proxy impacts what capabilities RavenDB can utilize.

This is a broken setup, I want to point out. It is also a highly misleading setup, because RavenDB is running in unsecured mode, but you are using HTTPS to access it. We intend to make this configuration setup raise an alert and block this from deployments. RavenDB goes to great lengths to ensure that you won’t have those pitfalls to stumble into. I have to admit that we have never actually considered this sort of setup as a scenario. I am strongly reminded of this.

RavenDB is amenable to running behind a proxy, of course. The key to doing so successfully is that the proxy is responsible for TCP traffic only, never interfering with the (encrypted) content that goes over the wire. As a result of this requirement, we don’t need to worry about the capabilities of the various proxies. As long as it is able to support TCP connections, all features of RavenDB will work.

time to read 8 min | 1507 words

The topic of this post is a bug in RavenDB, a pretty serious one. The end result is that a user reported that they got an error from RavenDB that they are unable to read a stored document. In some cases, RavenDB needs to read a document on startup, which means that it wasn’t able to start up if that document had this behavior.

As you can imagine, this is one of those issues that gets our full and immediate attention. The error itself gave us a lot of information:

 Dictionary mismatch on Dic #375
   at Voron.Data.Tables.ZstdLib.AssertSuccess(UIntPtr v, CompressionDictionary dictionary)

This is related to RavenDB’s document compression behavior. In order to get a great compression ratio from our documents, we train RavenDB on the recent documents that you have and generate a compression dictionary. The problem at hand is that the compression dictionary we have and the compression dictionary that was actually used are different. As you can see from the error, we are using zstd as the compression algorithm. When zstd generates a dictionary it will (by default) generate an id from that document that is mostly based on the xxhash64 of its content, rounded to 32 bits. You can see the relevant part here. This is pretty nice, since it means that there is a good chance that we’ll detect the wrong dictionary.

So now we know what is going on, but we don’t understand why.

When we wrote this feature, we were quite aware that we’ll not be able to make any sort of sense from the documents if we don’t have the right dictionary. For that reason, we store the dictionaries three times. Once inside of RavenDB itself and twice in ancillary files, which we can use during recovery. This sort of error should be utterly impossible. And yet, we had run into that in production, so we have to dig deeper still.

The primary suspect was the dictionary training portion. One of the things that RavenDB does on a continuous basis is measure the compression ratio of the documents, if we aren’t able to hit a good compression ratio, RavenDB will try to generate a new dictionary from the most recent documents and see if that new dictionary can do better. This can be very helpful in maintaining good compression rates. As your documents change, RavenDB will detect that and realize that it can do better, retrain on the recent data and compress even further. The problem is that this code path is also quite tricky, we first compress the document using the current dictionary, then we try generating a new dictionary and see if compressing with the new dictionary is better. If that is the case, we can install the new dictionary for future operations, otherwise, we need to discard it.

I suspected that the issue was somewhere around that area, we might not be handling the rejection of the new dictionary properly. So I went into the code and started digging, but I found absolutely nothing. The entire process is covered in tests and has been in production for close to 18 months, so this isn’t something that obvious.

After spending quite a bit of time on the issue, I decided that the code is perfect, it handled everything properly and taken into account all the right behaviors.

Clearly the fault was elsewhere. Before setting out to blame the nearest cat (you can never trust those), I had an idea, what if the problem wasn’t during the training process, but afterward?

Well, that doesn’t really matter, does it? RavenDB is a transactional database, if we had a failure after the training process, we’ll have to discard some of the data, for sure, but that would be about it. Unless, what if we have some state that wasn’t transactional? As part of looking at the compression training code, I ran into just such a scenario. Running the training to generate a new compression dictionary is an expensive proposition, so we don’t want to do that often. As such, we’ll do that for only about 1K document changes where we exceed the desired compression ratio by over 10%. How do we know to act every 1K documents? Well, we have a counter that we increment on every change. That value is incremented using Interlocked.Increment() and isn’t part of the transactional state. If the transaction is aborted, the value is still incremented.  The actual value doesn’t matter, mind, only that it is moving forward, so that isn’t an issue.

I mentioned the dictionary id before, but I should clarify that this is the zstd’s dictionary id. Internally, RavenDB uses a different value. That value is simply the sequence number of the dictionary, RavenDB counts the number of generated dictionaries and gives the new dictionary the next available value. That value, by the way, is part of the transaction. If we rollback a transaction, we’ll use the same dictionary id. But that doesn’t matter, of course.

When using compression dictionaries, we need to load them from a buffer. There is quite a bit of work that is involved in that, there is memory allocation, entropy tables to load, etc. In order to save repeated work, RavenDB caches the compression dictionaries (after all, their whole point is to be used repeatedly). That cache can be used by multiple transactions at the same time (two read transactions using the same dictionary will use the same instance).

Given all of this information, here is the sequence of events that we need to get the error in question:

  1. The user enabled documents compression.
  2. The user runs a transaction with at least four commands, which needs to satisfy the following conditions.
  3. A document write as the first action.
  4. Then a write to document whose compression ratio exceeded the expected ratio by over 10%, as a result, RavenDB tried to train a new compression dictionary.
  5. That dictionary had a better compression ratio and was accepted as the new default compression dictionary.
  6. RavenDB persisted the new dictionary and used that to compress the new document.
  7. Another command (in the same transaction) had stored a document in the same collection, now RavenDB will read the new dictionary and store that in a cache.
  8. A third command runs, but this one throws an error (such as optimistic concurrency violation).

At this point, RavenDB will rollback the entire transaction and return the error to the user. Let’s say the user has chosen to submit the same two documents again, shall we?

For the first command, we’ll again discover that the compression ratio (of the old compression dictionary) is insufficient. We will not generate a new compression dictionary, why is that? Remember the counter that we increment using Interlocked? That one was not rolled back, so we’ll need to wait for another 1K documents for the stars to properly align for us. That doesn’t impact correctness in any way, shape or form, however.

At this stage, the stage is set, but everything is still okay. The problem will happen on the next time that we’ll trigger a new dictionary. At that point, we’ll again scan the most recent documents, build a dictionary, etc. However, the dictionary id that RavenDB will use will be identical to the dictionary id that we previously discarded. The data that dictionary was trained on, however, will almost certainly be different. We persist the new dictionary to disk and everyone is happy, the new document that we wrote will use the new compression dictionary and we are perfectly fine.

The next write for this collection, however, will run into a problem. It will need to use the current (the new one) dictionary when we want to make a write. In order to do that, it will load the value using the cache, but there is already a value for that dictionary in the cache, the same dictionary that was discarded. At this point, RavenDB will start compressing documents using the in memory dictionary while the on disk dictionary is different.

If you’ll try to access the document which triggered the new dictionary, you’ll get an error, but documents that were modified later will continue working with no issue. Until you restart, of course.

On restart, we’ll read the dictionary from disk, where we wrote the new dictionary, at this point, all those documents that we wrote will give us the error above. Note that the sequence of events has to be very exact, you need to have a dictionary training as part of a multi act transaction which failed after the dictionary training has been successful and wrote additional documents. In a year and a half of production usage and very heavy load, that happened only a couple of times, it seems.

The issue has been fixed, of course and we’ll be rolling it out to both users and cloud customers. We’ll now rollback such in memory state on a transaction rollback as well, avoiding this issue entirely. It is amazing to me that despite very careful planning, it wasn’t the code itself that caused a problem, but a sequence of independent operations and failure modes that we never even considered about this.

FUTURE POSTS

No future posts left, oh my!

RECENT SERIES

  1. Production postmorterm (2):
    11 Jun 2025 - The rookie server's untimely promotion
  2. Webinar (7):
    05 Jun 2025 - Think inside the database
  3. Recording (16):
    29 May 2025 - RavenDB's Upcoming Optimizations Deep Dive
  4. RavenDB News (2):
    02 May 2025 - May 2025
  5. Production Postmortem (52):
    07 Apr 2025 - The race condition in the interlock
View all series

Syndication

Main feed Feed Stats
Comments feed   Comments Feed Stats
}