Oren Eini

CEO of RavenDB

a NoSQL Open Source Document Database

Get in touch with me:

oren@ravendb.net +972 52-548-6969

Posts: 7,583
|
Comments: 51,212
Privacy Policy · Terms
filter by tags archive
time to read 3 min | 588 words

I recently got an estimate for a feature that I wanted to add to NH Prof. It was for two separate features, actually, but they were closely related.

That estimate was for 32 hours.

And it caused me a great deal of indigestion. The problem was, quite simply, that even granting that there is the usual padding of estimates (which I expect), that timing estimate was off, way off. I knew what would be required for this feature, and it shouldn’t be anywhere near complicated enough to require 4 days of full time work. In fact, I estimated that it would take me a maximum of 6 hours and a probable of 3 hours to get it done.

Now, to be fair, I know the codebase (well, actually that isn’t true, a lot of the code for NH Prof was written by Rob & Christopher, and after a few days of working with them, I stopped looking at the code, there wasn’t any need to do so). And I am well aware that most people consider me to be an above average developer.

I wouldn’t have batted an eye for an estimate of 8 – 14 hours, probably. Part of the reason that I have other people working on the code base is that even though I can do certain things faster, I can only do so many things, after all.

But a time estimate that was 5 – 10 times as large as what I estimated was too annoying. I decided that this feature I am going to do on my own. And I decided that I wanted to do this on the clock.

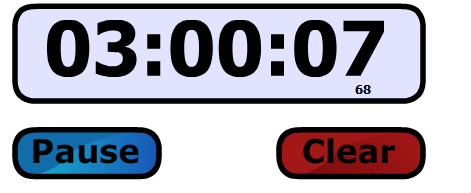
The result is here:

image

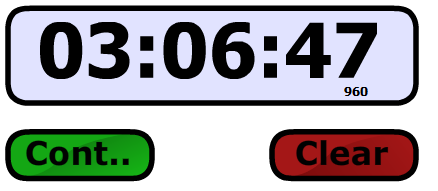
This is actually total time over three separate sittings, but the timing is close enough to what I though it would be.

This includes everything, implementing the feature, unit testing it, wiring it up in the UI, etc.

The only thing remaining is to add the UI works for the other profilers (Entity Framework, Linq to SQL, Hibernate and the upcoming LLBLGen Profiler) . Doing this now…

image

And we are done.

I have more features that I want to implement, but in general, if I pushed those changes out, they would be a new release that customers can use immediately.

Nitpicker corner: No, I am not being ripped off. And no, the people making the estimates aren't incompetent. To be perfectly honest, looking at the work that they did do and the time marked against it, they are good, and they deliver in a reasonable time frame. What I think is going on is that their estimates are highly conservative, because they don't want to get into a bind with "oh, we run into a problem with XYZ and overrun the time for the feature by 150%".

That also lead to a different problem, when you pay by the hour, you really want to have estimates that are more or less reasonably tied to your payments. But estimating with hours has too much granularity to be really effective (a single bug can easily consume hours, totally throwing off estimation, and it doesn't even have to be a complex one.)

time to read 2 min | 361 words

An interesting thing happened recently, when I started to build the profiler, a lot of the features were what I call Core Features. Those were the things that without which, we wouldn’t have a product. Things like detecting SQL, merging it into sessions, providing reports, etc. What I find myself doing recently with the profiler is not so much building Core Features, but building UX features. In other words, now that we have this in place, let us see how we can make better use of this.

Case in point, the new features that were just released in build 713. They aren’t big, but they are there to improve how people are commonly using the products.

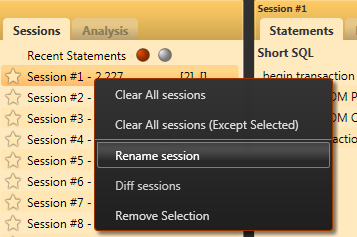
Renaming a session:

image

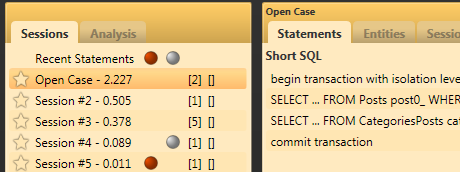
This is primarily useful if you are in a long profiling session and you want to mark a specific session with some notation:

image

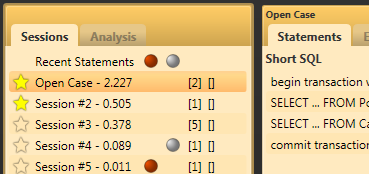
Small feature, and individually not very useful. But you might have noticed that the sessions are marked with stars around them. They weren’t there is previous builds, so what are they?

image

They are a way to tell the profiler that you really like those sessions :-)

More to the point, such sessions will not be removed when you clear the current state. That lets you keep around the previous state of the application as a base line while you work to improve it. Beside, it makes it much easier to locate them visually.

And finally, as a quicker way to do that, you can just ask the profiler to clear all but the selected features.

image

Not big features, but nice ones, I think.

time to read 2 min | 367 words

There seems to be some suspicion about the usage data from NH Prof that I published recently.

I would like to apologize for responding late to the comments, I know that there are some people who believe that I have installed a 3G chip directly to my head, but I actually was busy in the real world and didn’t look at my email until recently. The blog runs on auto pilot just so I’ll be able to do that, but sometimes it does give the wrong impression.

So, what does NH Prof “phone home” about?

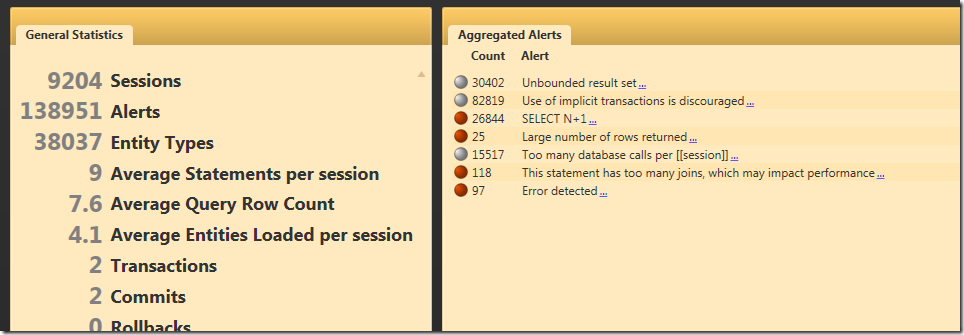
Well, the data is actually divided into two distinct pieces. Most of the data (numbers, usages, geographic location, etc) actually comes from looking at the server logs for the update check.

Another piece of data that the profiler reports is feature usage. There are about 20 – 30 individual features that are being tracked for usage. What does it means, tracking a feature?

Well, here are three examples that shows what gets reported:

image

image

image

There is no way to correlate this data to an individual user, nor is there a way to track the behavior of a single user.

I use this data mainly in order to see what features are being used most often (therefore deserving the most attention, optimizations, etc).

Those are mentioned in the product documentation.

To summarize:

  • I am not stealing your connection strings.
  • I don’t gather any personally identifying data (and I am at somewhat at a loss to understand what I would do with it even if I did).
  • There is never any data about what you are profiling being sent anywhere.

I hope this clear things out.

time to read 1 min | 105 words

It has been a while since we had a new major feature for the profiler, but here it is:

image

The expensive queries report will look at all your queries and surface the most expensive ones across all the sessions. This can give you a good indication on where you need to optimize things.

Naturally, this feature is available across all the profiler profiles (NHibernate Profiler, Entity Framework Profiler, Linq to SQL Profiler and Hibernate Profiler).

time to read 1 min | 122 words

After trying it out on NH Prof, profiler subscriptions are now opened for all the profilers.

A profiler subscription allows you to pay a small monthly free (~16$) and get the full profiler capabilities along with the assurance of no upgrade cost when the next major version comes out.

In addition to the monthly subscription, I got requests for a yearly subscription. I am not sure that I quite follow the logic, but I am not going to make it harder for people to give me money, so that is available as well for all profilers.

time to read 2 min | 265 words

One of the repeated requests for the profiler was to provide some alternative to the full price. After due consideration, I chose to implement an additional licensing model for the profiler, a subscription based one.

The current licensing model is still available and will not change!

What does this mean? Using the subscription model, you pay a monthly fee, and you can keep using the profiler as long as you pay.

The monthly fee is 12 Euro / 16$ US.

Why 12 Euro / 16$? It isn’t a “normal” price point.

When looking at the pricing model for subscriptions, I wanted to choose something low enough that most people wouldn’t mind paying. I choose this particular price point because this is how much a business lunch cost at a nearby restaurant. I believe that it should be low enough for everyone in the target audience.

The terms are simple:

  • Payment is made month to month (that is, you get charged each month for the profiler).
  • You can cancel the subscription at any point in time, and your copy of the profiler will expire when the time it due.
  • Upgrading between version will happen automatically. That is, if you are subscribed to version 1.x, you’ll get 2.x automatically.

Subscriptions are currently offered for NH Prof only, but we will expand that to the other profilers if this prove successful.

You can buy a subscription here.

time to read 2 min | 209 words

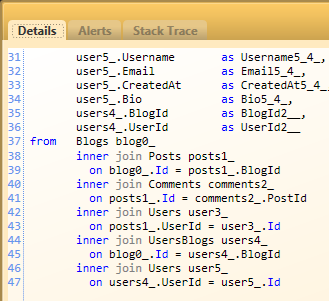
This is Josh’s feature, since we wrote most of the code for it together. Basically, it recognize a very common performance problem, queries that uses too many joins, such as this one:

image

Which would result in the following warning:

image

Queries with too many joins might be a performance problem. Each join requires the database to perform additional work, and the complexity and cost of the query grows rapidly with each additional join. While relational database are optimized for handling joins, it is often more efficient to perform several separate queries instead of a single query with several joins in it.

For OLTP systems, you should consider simplifying your queries or simplifying the data model. While I do not recommend avoiding joins completely, I strong discourage queries with large numbers of joins. Another issue to pay attention to is possible Cartesian products in queries contains joins, it is very easy to create such a thing and not notice it during development.

time to read 5 min | 827 words

This isn’t a new feature, because you can’t use it right now, but it is a really nice feature that we are working on, and I couldn’t resist showing it off hot “off the press”, so to speak.

Given the following query:

SELECT this_.id             AS id7_1_,
       this_.title          AS title7_1_,
       this_.subtitle       AS subtitle7_1_,
       this_.allowscomments AS allowsco4_7_1_,
       this_.createdat      AS createdat7_1_,
       posts2_.blogid       AS blogid3_,
       posts2_.id           AS id3_,
       posts2_.id           AS id0_0_,
       posts2_.title        AS title0_0_,
       posts2_.TEXT         AS text0_0_,
       posts2_.postedat     AS postedat0_0_,
       posts2_.blogid       AS blogid0_0_,
       posts2_.userid       AS userid0_0_
FROM   blogs this_
       LEFT OUTER JOIN posts posts2_
         ON this_.id = posts2_.blogid
WHERE  this_.id = 1 /* @p0 */

SELECT this_.id            AS id0_1_,
       this_.title         AS title0_1_,
       this_.TEXT          AS text0_1_,
       this_.postedat      AS postedat0_1_,
       this_.blogid        AS blogid0_1_,
       this_.userid        AS userid0_1_,
       comments2_.postid   AS postid3_,
       comments2_.id       AS id3_,
       comments2_.id       AS id2_0_,
       comments2_.name     AS name2_0_,
       comments2_.email    AS email2_0_,
       comments2_.homepage AS homepage2_0_,
       comments2_.ip       AS ip2_0_,
       comments2_.TEXT     AS text2_0_,
       comments2_.postid   AS postid2_0_
FROM   posts this_
       LEFT OUTER JOIN comments comments2_
         ON this_.id = comments2_.postid
WHERE  this_.blogid = 1 /* @p1 */

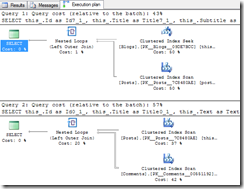
The profiler can show you the query plan using this UI:

image

And here is how the same query looks like using the query plan feature in Management Studio:

image

So, why implement it?

  • This isn’t limited to SQL Server, the profiler can display query plans for: SQL Server, Oracle, PostgreSQL and MySQL
  • This let you keep yourself in the flow, just hit a button to see the query plan, instead of copying the SQL, opening SSMS, displaying the query plan, etc.

Don’t discount the last one, making it easy is one of the core values of the profiler.

The idea is that if you make it easy enough, the barriers for using it goes away. If you can instantly see the query plan for a query, you are far more likely to look at it than if it takes 30 seconds to get that. At that point, you would only do it when you already have a performance problem.

FUTURE POSTS

  1. Production postmorterm: The rookie server's untimely promotion - about one day from now

There are posts all the way to Jun 11, 2025

RECENT SERIES

  1. Production postmorterm (2):
    02 Feb 2016 - Houston, we have a problem
  2. Webinar (7):
    05 Jun 2025 - Think inside the database
  3. Recording (16):
    29 May 2025 - RavenDB's Upcoming Optimizations Deep Dive
  4. RavenDB News (2):
    02 May 2025 - May 2025
  5. Production Postmortem (52):
    07 Apr 2025 - The race condition in the interlock
View all series

Syndication

Main feed Feed Stats
Comments feed   Comments Feed Stats
}