Oren Eini

CEO of RavenDB

a NoSQL Open Source Document Database

Get in touch with me:

oren@ravendb.net +972 52-548-6969

Posts: 7,583
|
Comments: 51,214
Privacy Policy · Terms
filter by tags archive
time to read 4 min | 626 words

Our monitoring system pinged us about a problem with a RavenDB cluster running in production. The problem was simple, we saw quite a bit of server restarts for that particular cluster. Looking deeper, it was obvious that the RavenDB instances for the cluster would occasionally run out of memory and crash. The customer, by the way, was unaware of this issue. From their perspective, the RavenDB cluster would switch the primary node for the database in question on a regular basis. On our end, we could see that each node would start using higher and higher memory and end up dying because of that. They would be restarted, of course, and the primacy of the cluster would switch automatically, but that is not a proper way to run.

The problem was figuring out what was going on. It took some time to figure out what exactly was going on. We didn’t see any such behavior on any other customer, but this customer had two factors that affected the outcome. The first is that the database in question is encrypted, which means that RavenDB will need some place to put the decrypted values. The second is that the user is issuing streaming queries that have a lot of results. We were able to reproduce the high memory usage when issuing the same queries, however, we were utterly unable to reproduce the problem when trying to run it on our own machines.

That was… strange, and it took a while to figure out that we need to run on Linux to get the issue. We subjected the system to a very high load on Windows, with no issue. On Linux, it would be quickly apparent that we are consuming more and more memory. We were able to narrow things down to this call:

posix_memalign(&ptr, 4096, 8192);

What we are asking here is an 8KB buffer aligned on 4KB boundary. And we were leaking those like crazy but we couldn’t figure out how. We are pretty careful with manual memory management and we have the tools around to detect leaks. Each and every call to allocate was also freed. The problem is that we aren’t the only ones using the system. Basically, posix_memalign will use the same memory pool as malloc(). The problem is memory fragmentation, basically. The way posix_memalign() works is to issue:

image

Where nb is 8192 bytes, alignment is 4096 bytes and MINSIZE is 32 bytes. We then release the end of the buffer, which ends up being ~4KB or so in most cases. Along with other allocations, that created severe fragmentation in our memory.

We need the memory to be page aligned, because we use that for direct memory access. The memory is typically pooled, so we won’t be allocating and freeing it all the time, but when you use streaming queries, you may be running through a lot of data, so we exceeded the size of the pool. At that point, we would allocate (and free), but we’ll also fragment the memory.

We fixed the issue by using mmap() directly, which will give us page aligned memory and won’t cause us to use more memory than needed. Given that we get page aligned memory with is a multiple of page size, we can be sure that we’ll get reuse of the memory, instead of having to deal with internal fragmentation inside the malloc implementation. With this change, there are no issues, and we are actually slightly faster than before.

The reason we didn’t run into the same problem on Windows, by the way? There we called VirtualAlloc() from the get-go, which will ensure that we have page aligned memory, so no need to deal with fragmentation.

time to read 8 min | 1563 words

We got a pretty nasty bug at a customer site a few months ago. Every now and then, the server running RavenDB will go into a high CPU mode, use 100% CPU and stay there for extended period of time. After a while, it will just return back to normal.

Looking at the details, there was nothing really that should cause this scenario. The amount of load of the system didn’t justify this load, we are talking about a maximum load of under 500 requests / second. RavenDB can handle that much on a Raspberry PI without straining itself, after all.

The problem was that we couldn’t figure out what was going on… none of the usual metrics were relevant. Typically, when we see high CPU utilization, the fault is either our code or the GC is working hard. In this case, however, while the RavenDB process was responsible for the CPU usage, there was no indication that it was any of the usual suspects. Here is what the spike looked like:

image

The customer has increased the size of the machine several time, trying to accommodate the load, but the situation was not getting better. In fact, the situation appeared to be getting worse. This is on a server running Windows 2016, and all the nodes in the cluster would experience this behavior, effectively taking the system down. The did not do that on an synchronized schedule, but one would go into a high CPU load, and the clients would fail to the other nodes, which will usually (but not always) trigger the situation. After a short while, it would get back down to normal rates, but that was obviously not a good situation.

After a while, we found something that was absolutely crazy. Looking at the Task Manager, we added all the possible columns and looked at them. Take a look at the following screen shot:

image

What you see here is the Page Fault Delta, basically, how many page faults happened in the system in the past second for this process. A high number on this column is when you see hundreds of page faults. Thousands of page faults usually means that you are swapping badly. Hundreds of thousands? I have never seen such a scenario and I couldn’t imagine what that actually is.

What is crazier is that this number should be physically impossible. At a glance, we are looking at a lot of reads from the disk, but looking at the disk metrics, we could see that we had very little activity there.

That is when we discovered that there is another important metric, Hard Page Faults / sec. That metric, on the other hand, typically ranged in the single digits or very low double digits, nothing close to what we were seeing. So what was going on here?

In addition to hard page faults (reading the data from disk), there is also the concept of soft page faults. Those page faults can happen if the OS can find the data it needs in RAM (the page cache, for example). But if it is in RAM, why do we even have a page fault in the first place? The answer is that while the memory may be in RAM, it may not have mapped to the process in question.

Consider the following image, we have two processed that mapped the same file to memory. On both processes, the first page is mapped to the same physical page. But the 3rd page on the second process (5678) is not mapped. What do you think will happen if the process will access this page?

image

At this point, the CPU will trigger a page fault, which the OS needs to handle. How is it going to do that? It can fetch the data from disk, but it doesn’t actually need to do so. What it needs to do is just update the page mapping to point to the already loaded page in memory. That is what is called a soft page fault (with hard page fault requiring us to go to disk).

Note that the CPU utilization above shows that the vast majority of the time is actually spent on system time, not user time. That means that the kernel is somehow doing a lot of work, but what is going on?

The issue with page fault delta was the key to understanding what exactly is going on here. When we looked deeper using ETW, we were able to capture the following trace:

image

What you can see in the image is that the vast majority of the time is spent in handling the page fault on the kernel side, as expected given the information that we have so far. However, the reason for this issue is that we are contending on an exclusive lock? What lock is that?

We worked with Microsoft to figure out what exactly is going on and we found that in order to modify the process mapping table, Windows needs to take a lock. That make sense, since you need to avoid concurrent modification to the page table. However, on Windows 2016, that is a process wide lock. Consider the impact of that. If you have a scenario where a lot of threads want to access pages that aren’t mapped to the process, what will happen?

On each thread, we’ll have a page fault and handle that. If the page fault is a hard page fault, we will issue a read and put the thread to sleep until this happen. But what if this is a soft page fault? Then we just need to take the process lock, update the mapping table and return. But what if I have a high degree of concurrency? Like 64 concurrent cores that all contend on the same exact lock? You are going to end up with the exact situation above. There is going to be a hotly contested lock and you’ll spend all your time at the kernel level.

The question now was, why did this happen? The design of RavenDB relies heavily on memory mapped I/O and it is something that we have been using for over a decade. What can cause us to have so many soft page faults?

The answer came from looking even more deeply into the ETW traces we took. Take a look at the following stack:

image

When we call FlushFileBuffers, as we need to do to ensure that the data is consistent on disk, there is a lot that is actually going on. However, one of the key aspects that seems to be happening is that Windows will remove pages that were written by FlushFileBuffers from the working set of the process. That will lead to page faults (soft ones). We confirmed with Microsoft that this is the expected behavior, calling FlushFileBuffers (fsync) will trim the modified pages from the process mapping table. This is done to improve coherency between the memory mapped pages and the page cache, I believe.

To reproduce this scenario, you’ll need to do something similar to:

  • Map a large number of pages (in this case, hundreds of GB)
  • Modify the data in those pages (in our case, write documents, indexes, etc)
  • Call FlushFileBuffers on the data
  • From many threads, access the recently flushed data (each thread ideally accessing a different page)

On Windows 2016, you’ll hit a spin lock contention issue and spend most of your time contending inside the kernel. The recommendation from Microsoft has been to move to Windows 2019, where the memory lock granularity has been increased, so they won’t all contend on the same lock. Indeed, testing on Windows 2019 we weren’t able to reproduce the problem.

The really strange thing here is that we have using the exact same code and approach in RavenDB for many years, and only recently did we see a shift with most of our customers running on Linux. That particular behavior is how we are used to be running, and I would expect it to be triggered often.

The annoying thing about this is that this is actually the case of too much of a good thing. Usually RavenDB will scale linearly with the number of cores for reads, the customer in question moved from RavenDB 3.5 to RavenDB 5.2, and they used the same size machine in both cases. RavenDB 5.2 is far more efficient, however. It was able to utilize the cores a lot better and trigger this behavior on a consistent basis. Using RavenDB 3.5, on the other hand, a lot of the CPU time was spent on doing other things, so we didn’t trigger this issue. Indeed, a workaround to improve performance was to reduce the number of cores on the system. That reduced the contention and made the whole system more stable.

The actual solution, however, was to run on Windows 2019, but that was a hard problem to solve. We tested pretty much any scenario that we could think to see what can help us here. And yes, we tested this on  Linux, and didn’t see any indication of a similar problem.

time to read 2 min | 221 words

On an otherwise uneventful morning, the life of the operations guy got… interesting.

What were supposed to be a routine morning got hectic because the database refused to operate normally. To be more exact, the database refused to load a file. RavenDB is generally polite when it run into issues, but this time, it wasn’t playing around. Here is the error it served:

---> System.IO.IOException: Could not set the size of file  D:\RavenData\Databases\Purple\Raven.voron to 820 GBytes

---> System.ComponentModel.Win32Exception (665): The requested operation could not be completed due to a file system limitation

Good old ERROR_FILE_SYSTEM_LIMITATION, I never knew you, because we have never run into an error with this in the past.

The underlying reason was simple, we had a large file (820GB) that was too fragmented. At some point, the number of fragments of the file bypassed the maximum size of the file system.

The KB article about this issue is here. You might be able to move forward more quickly by using the contig.exe tool to defrag a single file.

The root cause here was probably backing up to the same drive as the database, which forced the file system to break the database file into fragements.

Just a reminder that there are always more layers into the system and that we need to understand them all when they break.

time to read 3 min | 523 words

A RavenDB user called us with a very strange issue. They are running on RavenDB 3.5 and have run out of disk space. That is expected, since they are storing a lot of data. Instead of simply increasing the disk size, they decided to take the time and simply increase the machine overall capacity. They moved from a 16 cores machine to a 48 cores machine with a much larger disk.

After the move, they found out something worrying. RavenDB now used a lot more CPU. If previous the average load was around 60% CPU utilization, now they were looking at 100% utilization on a much more powerful machine. That didn’t make sense to us, so we set out to figure out what was going on. A couple of mini dumps and we were able to figure out what was going on.

It got really strange because there was the following interesting observation:

  • Under minimal load / idle – no CPU at all
  • Under high load – CPU utilization in the 40%
  • Under medium load – CPU utilization at 100%

That was strange. When there isn’t enough load, we are at a 100%? What gives?

The culprit was simple: BlockingCollection.

“Huh”, I can hear you say. “How can that be?”

A BlockingCollection should not be the cause of high CPU, right? It is in the name, it is blocking. Here is what happened. That blocking collection is used to manage tasks, and by default we are spawning threads to handle that at twice the number of available cores. All of these threads are sitting in a loop, calling Take() on the blocking collection.

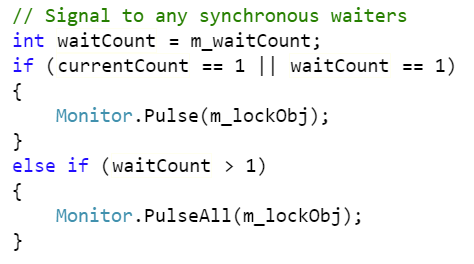
The blocking collection internally is implemented as using a SemaphoreSlim, which call Wait() and Release() on the values as needed. Here is the Release() method notifying waiters:

image

What you can see is that if we have more than a single waiter, we’ll update all of them. The system in question had 48 cores, so we had 96 threads waiting for work. When we add an item to the collection, all of them will wake and try to pull an item from the collection. Once of them will succeed, and then rest will not.

Here is the relevant code:

image

As you can imagine, that means that we have 96 threads waking up and spending a full cycle just spinning. That is the cause of our high CPU.

If we have a lot of work, then the threads are busy actually doing work, but if there is just enough work to wake the threads, but not enough to give them something to do, they’ll set forth to see how hot they can make the server room.

The fix was to reduce the number of threads waiting on this queue to a more reasonable number.

The actual problem was fixed in .NET Core, where the SemaphoreSlim will only wake as many threads as it has items to free, which will avoid the spin storm that this code generates.

time to read 3 min | 434 words

RavenDB makes extensive use of certificates for authentication and encryption. They allow us to safely communicate between distributed instances without worrying about a man in the middle or eavesdroppers. Given the choices we had to implement authentication, I’m really happy with the results of choosing certificates as the foundation of our authentication infrastructure.

It would be too good, however, to expect to have no issues with certificates. The topic of this point is a puzzler. A user has chosen to use a self signed certificate for the nodes in the cluster, but was unable to authenticate between the servers unless they registered the certificate in the OS’ store.

That sounds reasonable, right? If this is a self signed certificate, we obviously don’t trust it, so we need this extra step to ensure that we do trust it. However, we designed RavenDB specifically to avoid this step. If you are using a self signed certificate, the server will trust its own certificate, and thus will trust anyone that is using the same certificate.

In this case, however, that wasn’t happening. For some reason, the code path that we use to ensure that we trust our own certificate was not being activated, and that was a puzzler indeed.

One of the things that RavenDB does on first startup is to try to connect to itself as a client. It checks whatever it is successful or not. If not, we’ll try again, ignoring the registered root CAs. If we are successful at that point, we know what the issue here and ensure that we ignore the untrusted signer on the certificate. We only enable this code path if by default we don’t trust our own certificate.

Looking at the logs, we could see that we got a failure when talking to ourselves, some sort of a device not ready issue. That was strange. We hooked strace to look into what was going on, but there was nothing that was wrong at the sys call level. Then we looked into what was going on and realized that the issue was that the server’s was configured to use: https://ravendb-1.francecentral.cloudapp.azure.com/ but was actually hosted on https://ravendb-1-tst.francecentral.cloudapp.azure.com/

Do you see the difference?

The server was try to contact itself using the configured hostname. It failed, because of a DNS issue, so it couldn’t contact itself to figure out that the certificate was invalid. At that point, it didn’t install the hook and wouldn’t trust the self signed certificate.

So the issue started with investigating why we nodes in the cluster don’t trust each other with self signed certificate and got resolved by a simple configuration error.

time to read 7 min | 1238 words

The last production postmortem that I blogged about in real time was almost a year ago. This is something that makes me very happy, considering the uptick we see in RavenDB usage. All the efforts we put into making RavenDB more stable, predictable and robust has been paying off. The “downside” of that is that I have less interesting stories to tell, of course, but I’ll live with that.

Today’s story, however, is about the nastiest of problems. An occasional slow down in production that cause RavenDB to halt for about 5 seconds. The killer is that this is something that would only reproduce after several weeks of running, and it isn’t consistent. Once in a while, without any consistency, RavenDB would appear to stop processing requests for a period of a few seconds, and then resume normally. Those kind of bugs are the worst, because it is very hard to narrow down exactly what is going on, even before we get to trying to figure out the root cause.

We quickly ruled out the usual suspects. There was no high CPU, swapping to disk or slow I/O that can explain it. We tested the underlying hardware and it seemed fine as well. The problem would usually be quickly fixed if you restarted RavenDB, but sometimes that wasn’t enough. Restarting the whole server was required to get back to the baseline performance. Note that usually, RavenDB performed just fine, it is just that occasionally it would pause.

This naturally made us suspect that we have some issue with the GC causing pauses, but it didn’t make sense. Our allocation rates weren’t high and we didn’t have that big of a managed heap. In short, pretty much all avenues of investigation looked like they were closed to us.

We took several dumps of the process state and inspected what was going on there. Pretty much all indications pointed to there being an issue with the GC, but we couldn’t figure out why. Then we started to analyze the dump file in more detail, here is everything in the dump that was over 100MB:

The total size of the managed heap was just over 8GB, in a system with 64GB of RAM. So nothing really that interesting. The number of strings was high, I’ll admin, much higher than what we’ll usually find in a RavenDB process, but this database instance was doing heavy indexing, so that was probably the reason for this.

But pay very close attention to the second item from the end. That is about 800 MB (!!) of ThreadLocal<WeakReference>.LinkedSlotVolatile array. And that was suspicious. We looked into this a bit more and discovered that we had this tidbit:

00007f8203682ce0    50062      2002480 System.Threading.ThreadLocal`1[[System.WeakReference, System.Private.CoreLib]]

To start with, that isn’t too bad. We have 2MB or so of ThreadLocal<WeakReference> instances, no big deal. But look at the instance count (which is the second column). We had over 50,000 of those. And that didn’t seem right at all.

We started to investigate how ThreadLocal<T> works, and we found that it is really interesting. Here is the in memory structure of a ThreadLocal<T>. The internal structure is quite interesting:

image

Each ThreadLocal<T> instance has an id, which is generated sequentially. For each thread, there is a static thread local array that is allocated to store the values for this thread. The id of the ThreadLocal instance is used to index into this array. The array is for the local thread, but all the values across all threads for a particular ThreadLocal are held together as a doubly linked list.

Note that ThreadLocal has a trackAllValues constructor parameter that does not affect this behavior at all. It simply control whatever you are allowed to call the Values property, not whatever the thread local instance will track all the values.

Due to reasons that I’ll get to later, we created a lot of ThreadLocal instances. That means that we had instance ids in the high tens of thousands. When allocating the thread static array, the ThreadLocal will allocate an array that can hold its id (to the next power of two). So if we have a ThreadLocal with id of 50,062, it will allocate an array with 65,536 elements. That would explain the amount of memory that we saw in the memory dump and is interesting all on its own.

It did not explain the problem with the GC. At least, not yet. As we looked further into this issue, we noticed that this problem only occurred on very large database instances. Ones that had dozens of databases and many indexes. One of the ways that RavenDB ensure isolation of components is to have them each run in a different thread. In those machines,we have had processes that run with thousands of threads, usually in the range of 3000 to 6000.

Combine what we know about ThreadLocal and the number of threads, and you might start to see the problem. Not all ThreadLocals are used in all threads, but when they do, we need to allocate an array that is 65,536 elements in each of the threads. That translate to a total size that is measured in hundreds of millions.

That explains the size, again, but what about the GC speed? I wrote a small isolated test to see what this looks like and I was able to reproduce this on its own. That was really interesting, but I didn’t think that the issue was with ThreadLocal directly. Rather, the problem was with the lattice like structure that we have here. Because of this, I decided to check what it would cost for the GC to run on such a system without dealing with intermediaries.

Here is what this looks like:

On my machine, this code results in GC taking over 200ms each time on a heap that is less than 0.5 GB in size. Given how the GC works, it makes sense. And that means that the accidental lattice structure that we create using ThreadLocal is at the root of our troubles. The question is why do we have so many of them.

Internally, inside Lucene, there is a ThreadLocal<WeakReference> that is being used when you use a particular feature. This is used once per segment, so it isn’t too bad. However, consider what happens over time in a process that have thousands of indexes and is constantly busy?

Each indexing run will create a segment, and each one of them will have a ThreadLocal instance. At the same time, we also have a lot of threads, which create this exact scenario. The problem slowly accumulate over time. As you have more and more indexing runs, you’ll have more and more such instances and you’ll get to bigger and bigger arrays on each thread. This explains why we are able to see the issue only on instances that have been running for weeks, and then, only on those instances that run a particular set of queries that make use of this feature.

We reported the issue to the .NET team and I’m very curious about what the end result will be here. On our end, we are going to have to revamp how we are handling this type of situation. We have a plan of action already and we’ll see over the next week or so how it plays out in production load.

time to read 4 min | 602 words

imageI spoke about this in the video, and it seems to have caught a lot of people yes, so I thought that I would talk here a bit how we trace the root cause of a RavenDB critical issue to a printer being out of paper.

What is the relationship, I can hear you ask, between RavenDB, a document database, and a printer being out of paper? That is a good question. The answer is pretty much none. There is no DocPrint module inside of RavenDB and the last time yours truly wrote printer code was over fifteen years ago. But the story started, like all good tech stories, with a phone call. An inconveniently timed phone call, I might add.

Imagine, the year is 2013, and I’m enjoying the best part of the year, December. I love December for a few reasons. I was born in it, and it is a time where pretty much all our customers are busy doing other stuff and we can focus on pure development. So imagine my surprise when, on the other side of the line, I got a pretty upset admin that had to troubleshoot a RavenDB instance that would refuse to start. To make things interesting, this admin had drawn the short straw, I assume, and had to man the IT department while everyone else was on vacation. He had no relation to RavenDB during normal operations and only had the bare minimum information about it.

The symptoms were clear, luckily. RavenDB would simply refuse to start, hanging almost immediately, it seemed. No network access, nothing in the logs to indicate a problem. Just… hanging…

Here is the stack trace that we captured:

And that was… it. We started to look into it, and we run into this StackOverflow question, which was awesome. Indeed, restarting the print spooler would fix the problem and RavenDB would immediately start running. But I couldn’t leave it like this, and I guess the admin on the other side was kinda bored, because he went along with my investigation.

We now have access to the code (we didn’t in 2013) and can look at exactly what is going on. This comment had me… upset:

image

The service manager in Windows will consider any service that didn’t finish initialization in 30 seconds to be failed and kill it.  You might be putting the things together at this point?

After restarting the print spooler, we were able to start RavenDB, but restarting it cause another failure. Eventually we tracked it down to a network printer that was out of paper (presumably no one in the office to notice / fill it up). My assumption is that the print spooler was holding a register key hostage while making a network call to the printer that would time out because it didn’t have any paper. If at that time you would attempt to use a performance counter, you would hang, and if you are running as service, would be killed.

I’m left with nothing to do but quote Leslie Lamport:

A distributed system is one in which the failure of a computer you didn’t even know existed can render your own computer unusable.

Oh so true.

We ended up ditching performance counters entirely after running into so many issues around them. As of 2017, people were still running into this issue, so I think that was a great decision.

time to read 10 min | 1813 words

imageThis is a sordid tale of chance and mystery and the nasty tricks that Murphy can play on you.

A few customers reported an error similar to the following one:

Invalid checksum for page 1040, data file Raven.voron might be corrupted, expected hash to be 0 but was 16099259854332889469

One such case might be a disk corruption, but multiple customers reporting it is an indication of a much bigger problem. That was a trigger for a STOP SHIP reaction. We consider data safety a paramount goal of RavenDB (part of the reason why I’m doing this Production Postmortem series), and we put some of our most experienced people on it.

The problem was, we couldn’t find it. Having access to the corrupted databases showed that the problem occurred on random. We use Voron in many different capacities (indexing, document storage, configuration store, distributed log, etc) and these incidents happened across the board. That narrowed the problem to Voron specifically, and not bad usage of Voron. This reduced the problem space considerably, but not enough for us to be able to tell what is going on.

Given that we didn’t have a lead, we started  by recognizing what the issue was and added additional guards against it. In fact, the error itself was a guard we added, validating that the data on disk is the same data that we have written to it. The error above indicates that there has been a corruption in the data because the expected checksum doesn’t match the actual checksum from the data. This give us an early warning system for data errors and prevent us from proceeding on erroneous data. We have added this primarily because we were worried from physical disk corruption of data, but it turns out that this is also a great early warning system for when we mess up.

The additional guards were primarily additional checks for the safety of the data in various locations on the pipeline. Given that we couldn’t reproduce the issue ourselves, and none of the customers affected were able to reproduce this, we had no idea how to go from there. Therefor, we had a team that kept on trying different steps to reproduce this issue and another team that added additional safety measures for the system to catch any such issue as early as possible.

The additional safety measures went into the codebase for testing, but we still didn’t have any luck in figuring out what we going on. We went from trying to reproduce this by running various scenarios to analyzing the code and trying to figure out what was going on. Everything pointed to it being completely impossible for this to happen, obviously.

We got a big break when the repro team managed to reproduce this error when running a set of heavy tests on 32 bits machines. That was really strange, because all the reproductions to date didn’t run on 32 bits.

It turns out that this was a really lucky break, because the problem wasn’t related to 32 bits at all. What was going on there is that under 32 bits, we run in heavily constrained address space, which under load, can cause us to fail to allocate memory. If this happens at certain locations, this is considered to be a catastrophic error and requires us to close the database and restart it to recover. So far, this is pretty standard and both expected and desired reaction. However, it looked like sometimes, this caused an issue. This also tied to some observations from customers about the state of the system when this happened (low memory warnings, etc).

The very first thing we did was to test the same scenario on the codebase with the new checks added. So far, the repro team worked on top of the version that failed at the customers’ sites, to prevent any other code change from masking the problem. With the new checks, we were able to confirm that they actually triggered and caught the situation early. That was a great confirmation, but we still didn’t know what was going on. Luckily, we were able to add more and more checks to the system and run the scenario. The idea was to trip over a guard rail as early as possible, to allow us to inspect what actually caused it.

Even with a reproducible scenario, that was quite hard. We didn’t have a reliable method of reproducing it, we had to run the same set of operations for a while to hopefully reproduce this scenario. That took quite a bit of time and effort. Eventually, we figured out what was the root cause of the issue.

In order to explain that, I need to give you a refresher on how Voron is handling I/O and persistent data.

Voron is using MVCC model, in which any change to the data is actually done on a scratch buffer, this allow us to have snapshot isolation at very little cost and give us a drastically simplified model for working with Voron. Other important factors include the need to be transactional, which means that we have to make durable writes to disk. In order to avoid doing random writes, we use a Write Ahead Journal. For these reasons, I/O inside Voron is basically composed of the following operations:

  • Scratch (MEM) – copy on write data for pages that are going to be changed in the transaction. Usually purely in memory. This is how we maintain the Isolated and Atomic aspects on ACID.
  • Journal (WAL) – sequential, unbuffered, writes that include all the modifications to the transaction. This is how we maintain the Atomic and Durability aspects in ACID.
  • Flush (MMAP)– copy data from the scratch buffers to the data file, which allow us to reuse space in the scratch file.
  • Sync – (FSYNC) – ensure that the data from a previous flush is stored in durable medium, allow us to delete old journal files.

In Voron 3.5, we had Journal writes (which happen on each transaction commit) at one side of the I/O behavior and flush & sync as the other side. In Voron 4.0, we actually split it even further, meaning that journal writes, data flush and file sync are all independent operations which can happen independently.

Transactions are written to the journal file one at a time, until it reach a certain size (usually about 256MB), at which point we’ll create a new journal file. Flush will move data from the scratch buffers to the data file and sync will ensure that the data that was moved to the data file is durably stored on disk, at which point you can safely delete the old journals.

In order to trigger this bug, you needed to have the following sequence of events:

  • Have enough transactions happen quickly enough that the flush / sync operations are lagging by more than a single file behind the transaction rate.
  • Have a transaction start a new journal file while the flush operation was in progress.
  • Have, concurrently, the sync operation complete an operation that include that last journal file. Sync can take a lot of time.
  • Have another flush operation go on while the sync is in progress, which will move the flush target to the new journal file.
  • Have the sync operation complete, which only synced some of the changes that came from that journal, but because the new flush (which we didn’t sync yet) already moved on from that journal, mistakenly believe that this journal file is completed done and delete it.

All of these steps, that is just the setup for the actual problem, mind you.

In this case, we are prepared to have to this issue, but we aren’t yet to actually experience it. This is because what happened is that the persistent state (on disk) of the database is now suspect, if a crash happens, we will miss the oldest journal that still have transactions that haven’t been properly persisted to the data file.

Once you have setup the system properly, you aren’t done, in terms of reproducing this issue. We now have a race, the next flush / sync cycle is going to fix this issue. So you need to have a restart of the database within a very short period of time.

For additional complexity, the series of steps above will cause a problem, but even if you crash in just the right location, there are still some mitigating circumstances. In many cases, you are modifying the same set of pages in multiple transactions, and if the transactions that were lost because of the early deletion of the journal file had pages that were modified in future transactions, these transactions will fill up the missing details and there will be no issue. That was one of the issues that made it so hard to figure out what was going on. We needed to have a very specific set of timing between three separate threads (journal, flush, sync) that create the whole, then another race to restart the database at this point before Voron will fix itself in the next cycle, all happening just at the stage that Voron moves between journal files (typically every 256MB of compressed transactions, so not very often at all) and with just the right mix of writes to different pages on transactions that span multiple journal files.

These are some pretty crazy requirements for reproducing such an issue, but as the saying goes: One in a million is next Tuesday.

What made this bug even nastier was that we didn’t caught it earlier already. We take the consistency guarantees of Voron pretty seriously and we most certainly have code to check if we are missing transactions during recovery. However, we had a bug in this case. Because obviously there couldn’t be a transaction previous to Tx #1, we aren’t checking for a missing transaction at that point. At least, that was the intention of the code. What was actually executing was a check for missing transactions on every transaction except for the first transaction on the first journal file during recovery. So instead of ignoring just the the check on Tx #1, we ignored it on the first tx on all recoveries.

Of course, this is the exact state that we have caused in this bug.

Sigh.

We added all the relevant checks, tightened the guard rails a few more times to ensure that a repeat of this issue will be caught very early and provided a lot more information in case of an error.

Then we fixed the actual problems and subject the database to what in humans would be called enhanced interrogation techniques. Hammers were involved, as well as an irate developer with penchant to pulling the power cord at various stages just to see what will happen.

We have released the fix in RavenDB 4.1.4 stable release and we encourage all users to upgrade as soon as possible.

time to read 6 min | 1079 words

I’m certain that the archangel that is responsible for statistical grouping has a strange fondness for jokes. If that isn’t the case, I can’t really explain how we routinely get clear clustering of bug reports on specific issues. We have noticed that several years ago, when we suddenly started to get a lot of reports of a particular issue. There was no recent release and no reason for all of these correlated errors to happen all at once. But they did. Luckily, the critical mass of reports gave us more than enough information to figure out what the bug was and fix it. When we checked, the bug was there, dormant, for 20 months.

The current issue we are handling is a spate of reports about hard errors in RavenDB. The kind of errors that use the terms invalid data, in particular. These kind of errors bring development to a screeching halt, as we direct all available resources to figure out what is going on. We didn’t have a reproduction, but we did have a few cases of people reporting it and the stack trace we got told us that the problem wasn’t isolated to a single location but seemed to be fairly wide spread. This is a Good News / Bad News kind of situation. It is good because it means that the problem is in a low level component, it is bad because it is going to be hard to narrow it down exactly.

The common theme around this issue popped up when the system was already in a bad state. We were able to see that when we run out of disk space or when the memory on the system was very low. The common thread to these was that in both cases these are expected and handled scenarios. What is more, these are the kind of errors that we want to keep on shouldering through.

In general, the error strategy we use in most of RavenDB is fairly simple. Abort the transaction and give the user an error. If the error is considered catastrophic (I/O failure when writing to disk, for example), we also force a restart of the database (which does full recovery). As it turned out, there were three completely separate issues that we found when investigating this issue.

First, and the most critical one was cleanup code that wasn’t aware of the state of the system. For example, consider:

Let’s assume that we have an error during the WriteData. For example, we run out of space on disk. We abort the transaction and throw an exception. The FlushIndex() method, however, will go into the catch clause and try to cleanup its resources. When doing so, it will access the transaction (that was just aborted) and try to use it, still.

The problem is that at this point the state of the transaction is known bad, the only thing you are allowed to do is to dispose it, you cannot access anything on it. The code in question, however, is meant to be used on non transactional resource and require compensating actions to revert to previous state.

For that matter, the code above has another problem, however. Do you see the using statement here? It seemed like we have quite a bit of code that does stuff in the Dispose method. And if that stuff also touch the transaction, you may get what is called in the profession: “hilarity ensued”.

The problem was that our transaction code was too trusting and assumed that the calling code will not call it if it is in invalid state. Indeed, the cases where we did such a thing were rare, but when they happened.

The second problem was when we had code like this:

Except that the real code is a lot more complex and it isn’t as each to see what is going on.

What you see here is that we run commands, and as we process them, we may get (expected) exceptions, which we should report to the caller. The problem is that we mixed expected exceptions with unexpected ones. And these unexpected exceptions could leave us in… a funny state. At which point we would continue executing future commands and even commit the transaction. As you can imagine, that isn’t a good place to be at.

We have gone over our error handling and injected faults and errors at any later of the stack that we could conceive of. We have been able to fix a lot of issues, most of them have probably never been triggered, but it was a sobering moment to look at some of those changes. The most likely cause for the errors was a change that was made (by me, as it turns out) over two years ago. And in all that time, we never seen neither hide nor hair of it. Until suddenly we got several simultaneous cases.

The third and final problem, by the way, was related to not crashing. By default, any severe enough error should cause us to shut down the database and restart it. In the process, we re-apply the journal and ensure that we are in a consistent state. The problem is that we don’t want to do that for certain expected errors. And the issue with staying up was that while Voron (at the storage layer) handled the error properly, the higher level code did not. At that point we had a divergence of the in memory state vs. the on disk state. That usually led to either NRE that would remain until the server was restarted or really scary messages that would typically go away when we recovered the database and reloaded the in memory state from the on disk state.

In short, handling errors in the error handling code is tough.

The primary changes we made were on the transaction side, we made it validate its own state when called, so code that erroneously try to use a transaction that has already failed will error early. We have also added additional validation of operations in several key points. That would allow us to catch errors much more quickly and allow us to pinpoint exactly where things are breaking apart sooner.

The current state is that we pushed these changes to our production system and are running the usual battery of tests to prove that the changes are valid. We’ll also be adding more faults into the process to ensure that we exercise our error handling a lot more often.

time to read 9 min | 1610 words

image“If a tree falls in a forest and no one is around to hear it, does it make a sound?” is a well known philosophical statement. The technological equivalent of this is this story. We got a report that RavenDB was failing in the field. But the details around the failure were critical.

The failure happened on the field, literally. This is a system that is running an industrial robot using a custom ARM board. The failure would only happen on the robot on the field, would not reproduce on the user’s test environment or on our own systems. Initially, that was all the information that we had: “This particular robot works fine for a while, but as soon as there is a break, RavenDB dies and needs to be restarted”. That was the first time I run into a system that would crash when it went idle, instead of dying under load, I have to say.

My recommendation that they would just keep the robot busy at all time was shot down, but for a while, we were in the dark. It didn’t help that this was literally a custom ARM machine that we had no access to. We finally managed to figure out that the crash was some variant of SIGSEGV or SIGABRT. That was concerning. The ARM machine in question is running on 32 bits, and the worry was that our 32 bits code was somehow doing a read out of bound. This is a crash in production, so we allocated a couple of people to investigate and try to figure out what was going on.

We started by doing a review of all our 32 bits memory management code and in parallel attempted to reproduce this issue on a Raspberry Pi (the nearest machine we had to what was actually going on). We got a lucky break when we someone did manage to kill the RavenDB process on our own lab somehow. The exit code was 139 (Segmentation fault), but we weren’t sure what was actually going on. We were trying all sort of stuff on the machine, seeing what would cause this. We basically fed it all sorts of data that we had laying around and saw if it would choke on that. One particular data export would sometimes cause a crash. Sometimes. I really really hate this word. That meant that we were stuck with trying to figure out something by repeatedly trying and relying on the law of averages.

It took several more days, but we figured out that a certain sequence of operations would reliably cause a crash within 5 – 30 minutes. As you can imagine, this made debugging pretty hard. The same sequence of operations on Intel machines, either 32 bits or 64 bits worked without issue, regardless of many times we have repeated them.

We followed several false trails with our investigation into RavenDB’s memory management’s code in 32 bits. We had a few cases where we thought that we had something, but nothing popped up. We have instrumented the code and verified that everything seemed kosher, and it certainly did, but the system still crashed on occasion.

RavenDB usually relies on mmap() to access the data on disk, but on 32 bits, we couldn’t do that. With an addressable memory of just 2 GB, we cannot map the whole file to memory if it is too large. Because of that, we map portions of the file to memory as needed for each transaction. That led us to suspect that we were somehow unmapping memory while it was still in use or something like that. But we have gone through the code with a fine tooth comb and got nothing. We used strace to try to help point out what is going on and we could see that there were no surprise calls to unmap() that shouldn’t be there.

What was really nasty was the fact that when we failed with SIGSEGV, the error was always on an address just past the area of memory that we mapped. This lead us to suspect that we had an out of boundary write and led to a chase for that rouge pointer operation. We instrumented our code ever more heavily, but weren’t able to find any such operation. All our reads and writes were in bound, and that was incredibly frustrating. RavenDB is a CoreCLR application. As such, debugging it on an ARM device is… challenging. We tried lldb and gdb. Both allow unmanaged debugging, but even with lldb, we couldn’t debug managed code or even just pull the managed stack properly from ARM. Eventually we found this extension which allow to do SSH debugging on the Raspberry PI from a Windows machine.

That helped, and we finally figured out where in our managed code the error happened. This always happened during a copy of memory from a document write to a scratch buffer in a memory mapped file. The entire thing was wrapped in boundary checks and everything was good.

We went back to the drawing board and attempted to set it on fire, because it was no good for us. Once we put the fire out, we looked at what remained and had an Eureka! moment. Once of the differences between ARM and x86/x64 machines is in how they treat alignment. In x64/x86 alignment is pretty much a non issue for most operations. On ARM, however, an unaligned operation will cause a CPU fault. That led us to suspect that the SIGABRT error we got was indeed an alignment issue. Most of our code is already aligned on memory because while it isn’t mandatory on x64/x86, it can still get better perf in certain cases, but it is certainly possible that we missed it.

We discovered a horrifying problem:

image

We were using the CopyBlock method, and obviously that was the issue, right? We wrote a small test program that simulated what we were doing and used unaligned CopyBlock and it just worked. But maybe our situation is different?

Using CopyBlockUnaligned on x86 led to a 40% performance drop (we call this method a lot) and initially it looked like it fixed the problem on ARM. Except that on the third or forth attempts to reproduce the problem, we run into our good old SIGSEGV again, so that wasn’t it. This time we went to the drawing board and broke it.

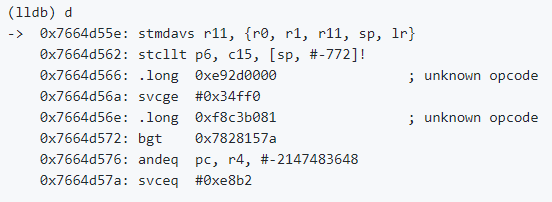
During this time, we have managed to capture the error inside the debugger several times, here is what this looked like:

image

Reading ARM assembly is not something that I’m used to do, so I looked at the manual, and it looks like this instruction is to store multiple registers in descending order and… no clue beyond that. It didn’t make any sort of sense to us.

At this point, we were several weeks and four or five people into this investigation (we consider such issues serious). We have instrumented our code to the point where it barely run, we could manage to reproduce the error in a relatively short time and we were fairly convinced that we were doing things properly. Going over the kernel code for memory mapping and unmapping several times, stracing, debugging, everything. We were stumped. But we also had enough data at this point to be able to point a fairly clear picture of what was going on. So we opened an issue for the CoreCLR about this, suspecting that the issue is in the implementation of this CopyBlockUnaligned.

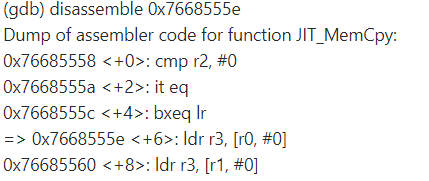
We got a strange response, though: “This assembly code doesn’t make any sense”. I did mention that I have no idea about ARM assembly, right?  We tried reproducing the same thing in gdb, instead of lldb and got the following assembly code:

image

This looked a lot more readable, to be sure. And it was extremely suspicious. Let me explain why:

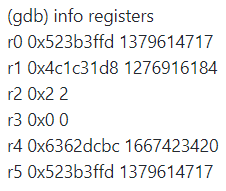
image

The faulting instruction is: ldr r3, [r0, #0]

What this says is basically, read a word from the address pointed to by r0 (with 0 offset) into r3.

Now, r0 in this case has this value: 0x523b3ffd. Note the last three characters, ffd.

We are running this on a 32 bits machine, so a word is 4 bytes in side. FFD+4 = 1001

In other words, we had a read beyond the current page boundary. In most cases, the next page is mapped, so everything goes smoothly. In some cases, the next page is not mapped, so you are going to get an access violation trying to read a byte from the next page.

The fix for this is here:

image

This is literally a single character change. And probably the worst lines of codes / time invested that I have ever seen for any bug. Actually, there wasn’t even any code change in RavenDB’s codebase, so that is 0 lines of code / 4 people x 4 weeks.

The good thing is that at least we have proven that the 32 bits memory code is rock solid, and we have a lot better understanding on how to resolve the next issue.

FUTURE POSTS

No future posts left, oh my!

RECENT SERIES

  1. Production postmorterm (2):
    11 Jun 2025 - The rookie server's untimely promotion
  2. Webinar (7):
    05 Jun 2025 - Think inside the database
  3. Recording (16):
    29 May 2025 - RavenDB's Upcoming Optimizations Deep Dive
  4. RavenDB News (2):
    02 May 2025 - May 2025
  5. Production Postmortem (52):
    07 Apr 2025 - The race condition in the interlock
View all series

Syndication

Main feed Feed Stats
Comments feed   Comments Feed Stats
}