Oren Eini

CEO of RavenDB

a NoSQL Open Source Document Database

Get in touch with me:

oren@ravendb.net +972 52-548-6969

Posts: 7,583
|
Comments: 51,214
Privacy Policy · Terms
filter by tags archive
time to read 6 min | 1019 words

imageAs part of our 4.0 deployment, we have a cluster made of mixed machines, some running Windows, some running Linux. In one particular configuration, we have 2 Windows services and a single Linux machine. We setup the cluster and started directing production traffic to it, and all was good. We left for the weekend and came back the following week, to see what the results were.  Our Linux machine was effectively down. It was not responding to queries and it seemed like it was non responsive.

That was good and bad. It was good because the rest of the cluster just worked, and there was no interruption in service. This is as designed, but it is always nice to see this in real life. It is bad because it isn’t supposed to be happening. What was really frustrating was that we were able to log into the machine and there was nothing wrong there.

No high CPU or memory, no outstanding I/O or anything of the kind that we are used to.

The first clue for us was trying to diagnose the problem from inside the machine, where we able to reproduce it by trying to access the server from the local machine, resulting in the exact same issue as observed externally. Namely, the server would accept the connection and just leave it hanging, eventually timing out.

That was a interesting discovery, since it meant that we can rule out anything in the middle. This is a problem in this machine. But the problem remained quite hard to figure out. We deployed to production in a manner similar to what we expect our users will do, so we used Let’s Encrypt as the certificate authority with auto generated certificates.

So we started by seeing where the problem is, whatever this is on the TCP side or the SSL side, we issued the following command:

openssl s_client -connect b.cluster-name.dbs.local.ravendb.net:443

This command showed immediate connection to the server and the client sending the ClientHello properly, but then just hanging there. What was really interesting is that if we waited about 2 minutes, that SSL connection would complete successfully. But we couldn’t figure out any reason why this would be the case. It occurred to me that it might be related to the system handling of reverse DNS lookup. The two minutes timeout was very suspicious, and I assumed that it might be trying to lookup the client certificate and somehow resolve that. That isn’t how it works in general, although the fact that some SSH (and not SSL/TLS) configuration directly relate to this has led us in a merry chase.

Eventually we pulled strace and looked into what is actually going on. We focused on the following calls:

sudo strace -fp 1017 -s 128 -Tfe open,socket,connect,sendto,recvfrom,write

The interesting bits from there are shown here:

As you can see, we are looking at some DNS resolution, as we can tell from the /etc/resolv.conf and /etc/hosts open() calls. Then we have a connect() to 172.31.0.2 which is an AWS name server. Note that this is done over UDP, as you can see from the SOCK_DGRAM option in the preceding socket() call.

We are getting some data back, and we can see identrust there. And then we see something really suspicious. We have a TCP socket call that goes to 192.35.177.64 on port 80. In other words, this is an HTTP call. What does an HTTP call is doing in the middle of an SSL handshake?

As it turned out, our firewall configuration was blocking outbound connections to port 80. We tested removing that rule and everything came back online and the server was running just fine.

Further inspection revealed that we were calling to: http://apps.identrust.com/roots/dstrootcax3.p7c

And this is where things started to jell together. We are using Let’s Encrypt certificates, and in order to ensure trust, we need to send the full chain to the user. SSL Certificates has the notion of Authority Information Access, which is basically a URL that is registered in the certificate that points to where you can find the certificate that signed this one.

Why is this using HTTP? Because the data that will be fetched is already signed, and it is not a secret. And trying to use HTTPS to fetch it might get us into a loop.

So whenever we had a new SSL connection, we’ll try to connect to IdenTrust to get the full chain to send to the client. The killer here is that if we fail to do so, we’ll send the certificate chain we have (without the missing root), but it will work, since the other side already have this root installed (usually). On Windows, this certificate is installed, so we didn’t see it. On Linux, we didn’t have that certificate installed, so we had to look it up every single time.

The gory details, including dives into the source code are in the GitHub issue. And I do think they are gory. In this case, once we realized what was going on we were able to take steps to handle this. We needed to pre-register the entire chain on the local machine, so any lookup will be able to find it locally, and not do a network call per each SSL connection.

But beyond mutating the global certificate store, there is no real way to prevent that remote call.

Note that this is also true for Windows, although that seems to be implemented much deeper in the stack, and not in managed code, so I wasn’t able to trace where this is actually happening. The really bad thing here is that from the outside, there is no way for us to control or disable this, so this is just something that you have to remember to do when you use certificates, make sure that the entire chain is registered on each machine, otherwise you might have a remote call per connection, or a very long (and synchronous!) hang until the request times out if you are blocking outgoing access.

time to read 10 min | 1883 words

In terms of severity, there are very few things that we take more seriously than data integrity. In fact, the only thing that pops to mind as higher priority are security issues. A user reported an error when using a pre-release 4.0 database that certainly looked like data corruption, so we were very concerned when we go the report, and quite happy about the actual error. If this is strange, let me explain.

Storage bugs are nasty. I suggest reading this article to understand how tricky these can be. The article talks about memory allocators (even though it calls them storage) but the same rules apply. And the most important rule from this article?

WHEN A MEMORY DAMAGE BUG IS OBSERVED, IT TAKES PRIORITY OVER ALL OTHER BUG FIXES, ENHANCEMENTS, OR ANY OTHER DEVELOPMENT ACTIVITY.  ALL DEVELOPMENT CEASES UNTIL IT IS FOUND.

You can read the article for the full reasoning why, but basically is about being able to  reproduce and fix the bug and not make it “go away” with a hammer approach. We do the same with data corruption. One of our developers stops doing anything else and investigate just that, as a top priority issue. Because we take this so seriously, we have built several layers of defense in depth into RavenDB.

All the data is signed and we compare hashed when reading from disk to validate that it hasn’t been modified. This also help us catch an enormous amount of problems with storage devices and react to them early. There are other checks that are being run to verify the integrity of the system, from debug asserts to walking the structure of the data and verifying its correctness.

In this case, analysis of the data the user provided showed that we were failing the hash validation, which should usually only happen if there is a physical file corruption. While we were rooting for that (since this would mean no issues with our code), we also looked into the error in detail. What we found was that we were somehow starting to read a document from the middle, instead of the beginning. Somehow we managed to mess up the document offset and that caused us to think that the document was corrupted.

At this point, we had a confirmed data corruption issue, since obviously we shouldn’t lose track of where we put the documents. We pulled another developer into this, to try to reproduce the behavior independently while checking if would salvage the user’s data from the corrupted files. This deserve some explanation. We don’t assume that our software is perfect, so we took steps in advanced. The hashing the data and validating it is one such step, but another is build, upfront, the recovery tools for when the inevitable happens. That meant that the way we lay out the data on disk was designed, upfront and deliberately, to allow us to recover the data in the case of corruption.

Admittedly, I was mostly thinking about corruption of the data as a result of physical failure, but the way we lay out the data on disk also protect us from errors in record keeping such as this one. This meant that we were able to extract the data out and recover everything for the user.

At this time, we had a few people trying to analyze the issue and attempting to reproduce it. The problem with trying to figure out this sort of issue from the resulting file is that by the time you have found the error, this is too late, the data is already corrupted and you have been operating in a silent bad state for a while, until it finally got to the point this become visible.

8011098[3]We had the first break in the investigation when we managed to reproduce this issue locally on a new database. That was great, because it allowed us to rule out some possible issues related to upgrading from an earlier version, which was one of the directions we looked at. The bad part was that this was reproduced mostly by the developer in question repeatedly hitting the keyboard with his head in frustration. So we didn’t have a known way to reproduce this.

Yes, I know that animated GIFs are annoying, so was this bug, I need a way to share the pain. At one point we got something that could reliably generate an error, it was on the 213th write to the system. Didn’t matter what write, but the 213th write will always produce an error. There is nothing magical about 213, by the way, I remember this value because we tried so very hard to figure out what was magical about it.

At this point we had four or five developers working on this (we needed a lot of heads banging on keyboards to reproduce this error). The code has been analyzed over and over. We found a few places where we could have detected the data corruption earlier, because it violated invariants and we didn’t check for that. That was the first real break we had. Because that allowed us to catch the error earlier, which let to less head banging before the problem could be reproduced. The problem was that we always caught it too late, we kept going backward in the code, each time really excited that we are going to be able to figure out what was going on there and realizing that the invariants this code relied on were already broken.

Because these are invariants, we didn’t check them, they couldn’t possibly be broken. That sounds bad, because obviously you need to validate your input and output, right? Allow me to demonstrate a sample of a very simple storage system:


There isn’t anything wrong with the code here at first glance, but look at the Remove method, and now at this code that uses the storage:

The problem we have here is not  with the code in the Remove or the GetUserEmail method, instead, the problem is that the caller did something that it wasn’t supposed to, and we proceeded on the assumption that everything is okay.

The end result is that the _byName index contained a reference to a deleted document, and calling GetUserEmail will throw a null reference exception. The user visible problem is the exception, but the problem was actually caused much earlier. The invariant that we violating could have been caught in the Remove method, though, if we did something like this:

These sort of changes allow us to get earlier and earlier to the original location where the problem first occurred. Eventually we were able to figure out that a particular pattern of writes would put the internal index inside RavenDB into a funny state, in particular, here is how this looks like from the inside.

image

What you see here is the internal structure of the tree inside RavenDB used to map between documents etags and their location on the disk. In this case, we managed to get into a case where we would be deleting the last item from a page that is the leftmost page in a tree that has 3 or more levels and whose parent is the rightmost page in the grandparent and is less than 25% full while the sibling to its left is completely full.

In this case, during rebalancing operation, we were forgetting to reset the downward references and ended up messing up the sort order of the tree. That worked fine, most of the time, but it would slowly poison our behavior, as we made binary searches on data that was supposed to be sorted but wasn’t.

Timeline (note, despite the title, this is pre released software and this is not a production system, the timeline reflects this):

  • T-9 day, first notice of this issue in the mailing list. Database size exceed 400GB. Back and forth with the user on figuring out exactly what is going on, validating the issue is indeed corruption and getting the data.
  • T-6 days, we start detailed analysis of the data in parallel to verifying that we can recover the data.
  • T-5 days, user has the data back and can resume working normally, investigation proceeds.
  • T-4 days, we have managed to reproduced this on our own system, no idea how yet.
  • T-3 days, head banging on keyboards, adding invariants validations and checks everywhere we can think of.
  • T-2 days, managed to trap the root cause of the issue, tests added, pruning investigation code for inclusion in product for earlier detection of faults.
  • Issue fixed
  • T – this blog post is written Smile.
  • T + 3 days, code for detecting this error and automatically resolving this is added to the next release.

For reference, here is the fix:

image

The last change in the area in question happened two years ago, by your truly, so this is a pretty stable part of the code.

In retrospect, there are few really good things that we learned from this.

  • In a real world situation, we were able to use the recovery tools we built and get the user back up in a short amount of time. We also found several issues with the recovery tool itself, mostly the fact that its default logging format was verbose, which on a 400GB database means an enormous amount of logs that slowed down the process.
  • No data was lost, and these kinds of issues wouldn’t be able to cross a machine boundary so a second replica would have been able to proceed.
  • Early error detection was able to find the issue, investment with hashing and validating the data paid off handsomely here. More work was done around making the code more paranoid, not for the things that it is supposed to be responsible for but to ensure that other pieces of the code are not violating invariants.
  • The use of internal debug and visualization tools (such as the one above, showing the structure of the internal low level tree) was really helpful with resolving the issue.
  • We focused too much on the actual error that we got from the system (the hash check that failed), one of the things we should have done is to verify the integrity of the whole database at the start, which would have led us to figure out what the problem was much earlier. Instead, we suspected the wrong root cause all along all the way to the end. We assumed that the issue was because of modifications to the size of the documents, increasing and decreasing them in a particular pattern to cause a specific fragmentation issue that was the root cause of the failure. It wasn’t, but we were misled about it for a while because that was the way we were able to reproduce this eventually. It turned out that the pattern of writes (to which documents) was critical here, not the size of the documents.

Overall, we spent over a lot of time on figuring out what the problem was and the fix was two lines of code. I wrote this post independently of this investigation, but it hit the nail straight on.

time to read 2 min | 253 words

A customer complained that every now and then RavenDB is hitting 100% CPU and stays there. They were kind enough to provide a minidump, and I started the investigation.

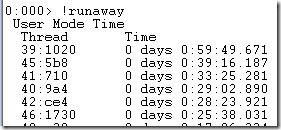
I loaded the minidump to WinDB and started debugging. The first thing you do with high CPU is rung the “!runaway” command, which sorts the threads by how busy they are:

image

I switched to the first thread (39) and asked for its stack, I highlighted the interesting parts:

image

This is enough to have a strong suspicion on what is going on. I checked some of the other high CPU threads and my suspicion was confirmed, but even from this single stack trace it is enough.

Pretty much whenever you see a thread doing high CPU within the Dictionary class it means that you are accessing it in a concurrent manner. This is unsafe, and may lead to strange effects. One of them being an infinite loop.

In this case, several threads were caught in this infinite loop. The stack trace also told us where in RavenDB we are doing this, and from there we could confirm that indeed, there is a rare set of circumstances that can cause a timer to fire fast enough that the previous timer didn’t have a chance to complete, and both of these timers will modify the same dictionary, causing the issue.

time to read 7 min | 1231 words

johnny-automatic-lame-fox-300pxThis isn’t actually about a production system, per se. This is about a performance regression we noticed in a scenario for 4.0. We recently started doing structured performance testing as part of our continuous integration system.

There goes the sad trombone sound, because what that told us is that at some point, we had a major performance regression. To give you that in numbers, we used to be around 50,000 writes per second (transactional, fully ACID, hit the disk, data is safe) and we dropped to around 35,000 writes per second. Fluctuations in performance tests are always annoying, but that big a drop couldn’t be explained by just random load pattern causing some variance in the results.

This was consistent and major difference between the previous record. Now, to explain things, the last firm numbers we had about this performance test was from Dec 2016. Part of the release process for 4.0 calls for a structured and repeatable performance testing, and this is exactly the kind of thing that it is meant to catch. So I’m happy we caught it, not so happy that we had to go through about 7 months of changes to figure out what exactly drove our performance down.

The really annoying thing is that we put a lot of effort into improving performance, and we couldn’t figure out what went wrong there. Luckily, we could scan the history and track our performance over time. I’m extremely over simplifying here, of course. In practice this meant running bisect on all the changes in the past 7 – 8  months and running benchmarks on each point. And performance is usually not something as cut and dried as a pass / fail test.

Eventually we found the commit, and it was small, self contained and had a huge impact on our performance. The code in question?

ThreadPool.SetMinThreads(MinThreads, MinThreads);

This change was part of ironically, a performance run that focused on increasing the responsiveness of the server under a specific load. More specifically, it handled the case where under a harsh load we would run into thread starvation. The problem with this load is that this specific load can only ever happen in our test suite. At some point we had run up to 80 parallel tests, each of which might spawn multiple servers. The problem is that we run them all a single process, so we run into a lot of sharing between the different tests.

That was actually quite intentional, because it allowed us to see how the code behaves in a bad environment. It exposed a lot of subtle issues, but eventually it got very tiring to have tests fail because there just weren’t enough threads to run them fast enough. So we set this value to a high enough number to not have to worry about this.

The problem is that we set it in the server, not in the tests. And that led to the performance issue. But the question is why would this setting cause such a big drop? Well, the actual difference in performance went from 20 μs to taking 28.5 μs, which isn’t that much when you think about it. The reason why this happened is a bit complex, and require understanding several different aspect of the scenario under test.

In this particular performance scenario, we are testing what happens when a lot of clients are writing to the database all at once. Basically, this is a 100% small writes scenario. Out aim here is to get sustained throughput and latency throughout the scenario. Given that we ensure that every write to RavenDB actually hit the disk and is transactional, that means that every single request needs to physically hit the disk. If we tried doing that for each individual request, that would lead to about 100 requests a second on a good disk, if that.

In order to avoid the cost of having to go to the physical disk, we do a lot of batching. Basically, we read the request from the network, do some basic processing and then send it to a queue where it will hit the disk along with all the other concurrent requests. We make heavy use of async to allow us to consume as little system resources as possible. This means that at any given point, we have a lot of requests that are in flight, waiting for the disk to acknowledge the write. This is pretty much the perfect system for high throughput server, because we don’t have to hold up a thread.

So why would increasing the amount of minimum threads hurt us so much?

To answer that we need to understand what it is exactly that SetMinThreads control. The .NET thread pool is a lazy one, even if you told it that the minimum number of threads is 1000, it will do nothing with this value. Instead, it will just accept work and distribute it among its threads. So far, so good. The problem starts when we have more work at hand then threads to process it. At this point, the thread pool need to make a decision, it can either wait for one of the existing threads to become available of it can create a new thread to  handle the new load.

This is when SetMinThreads come into play. Up until the point the thread pool created enough threads to exceed the min count, whenever there is more work in the pool then there are threads, a new thread will be created. If the minimum number of threads has been reached, the thread pool will wait a bit before adding new threads. This allow the existing threads time to finish whatever they were doing and take work from the thread pool. The idea is that given a fairly constant workload, the thread pool will eventually adjust to the right amount of threads to ensure that there isn’t any work that is sitting in the queue for too long.

With the SetMinThreads change, however, we increased the minimum number of threads significantly, and that caused the thread pool to create a lot more threads then it would otherwise create. Because our workload is perfect for the kind of tasks that the thread pool is meant to handle (short, do something and schedule more work then yield) it is actually very rare that the thread pool would need to create an additional thread, since a thread will be available soon enough.

This is not an accident, we very careful set out to build it in this fashion, of course.

The problem is that with the high number of minimum threads, it was very easy to get the thread pool into a situation where it had more work then threads. Even though we would have a free thread in just a moment, the thread pool would create a new thread at this point (because we told it to do so).

That lead to a lot of threads being created, and that lead to a lot of context switches and thread contentions as the threads are fighting over processing the incoming requests. In effect, that would take a significant amount of the actual compute time that we have for processing the request. By removing the SetMinThreads calls, we reduced the number of threads, and were able to get much higher performance.

time to read 2 min | 326 words

imageA customer called us with a problem, for the most part, RavenDB was very well behaved, but they were worried about the 99.99% percentile of request duration. While the 99.9% was excellent (around a few milliseconds), the 99.99% was measured in seconds.

Usually, this is a particularly slow request that happens, and we can handle that by figuring out what is slow on that particular request and fix it. Common causes for such an issue is a request that returns a lot of unnecessary data, such as large full documents, when it needs just a few fields.

In this case, however, our metrics told us that the problem was pretty widespread. There wasn’t a particular slow request, rather, at what appeared to be random times, certain requests would be slow. We also realized that it wasn’t a particular request that was slow, but all requests within a given time period.

That hinted quite strongly at the problem, it was very likely that this is a GC issue that caused a long pause. We still had to do some work to rule out other factors, such as I/O / noisy neighbors, but we narrowed down on GC as being the root cause.

The problem in this case was that the customer was running multiple databases on the same RavenDB process. And each of them was fairly large. The total amount of memory that the RavenDB process was using was around 60GB of managed memory. At that level, anything that would cause a GC can cause a significant pause and impact operations.

The solution in this case was to break that into multiple separate processes, one for each database. In this manner, we didn’t have a single managed heap that the GC had to traverse, each heap was much smaller, and the GC pause times were both greatly reduced and spaced much further apart.

time to read 3 min | 522 words

1329757286-300pxWe got a puzzle. A particular customer was seeing very high latency in certain operations on a fairly frequent basis. The problem is that when this happened, the server was practically idle, serving around 5% of the usual requests/sec. What was even stranger was that during the times when we had reached the peek of requests/seconds, we’ll see no such slowdowns. The behavior was annoyingly consistent, we’ll see no slowdown at all during high load, but after a period of relatively light load, the server would appear to choke.

That one took a lot of time to figure out, because it was so strange. The immediate cause was pretty simple to figure out, the server was busy paging into memory a lot of data, but why would it need to do this? The server was just sitting there doing nothing much, but it was thrashing like crazy, and that was affecting the entire system.

I’ll spare you the investigation, because it was mostly grunting and frustration, but the sequence of events as we pieced it together was something like this:

  • The system is making heavy use of caching, with a cache duration set to 15 minutes or so. Most pages would hit the cache first, and if there was a miss, generate it and save it back. The cached documents was setup with the RavenDB expiration bundle.
  • During periods of high activity, we’ll typically have very few cache expiration (because we kept using the cached data) and we’ll fill up the cache quite heavily (the cache db was around 100GB or so).
  • That would work just fine and rapidly be able to serve a high number of requests.
  • And then came the idle period…
  • During that time, we had other work (by a different process) going on in the server, which we believe would give the OS reason to page the now unused memory to disk.

So far, everything goes on as predicted, but then something happens. The expiration timer is hit, and we now have a lot of items that need to be expired. RavenDB expiration is coarse, and it runs every few minutes, so each run we had a lot of stuff to delete. Most of it was on disk, and we needed to access all of it so we can delete it. And that caused us to trash, affecting the overall server performance.

As long as we were active, we wouldn’t expire so much at once, and we had a lot more of the db in memory, so the problem wasn’t apparent.

The solution was to remove the expiration usage and handle the cache invalidation in the client, when you fetched a cached value, you checked its age, and then you can apply a policy decision if you wanted to update it or not. This actually turned out to be a great feature in general for that particular customer, since they had a lot of data that can effectively be cached for much longer periods, and that gave them the ability to express that policy.

time to read 3 min | 542 words

A customer reported that under memory constrained system, a certain operation is taking all the memory and swapping hard. On a machine with just a bit more memory, the operation completed very quickly. It didn’t take long to figure out what was going on, we were reading too much, and we started swapping, and everything went to hell after that.

The problem is that we have code that is there specifically to prevent that, it is there to check that the size that we load from the disk isn’t too big, and that we aren’t doing something foolish. But something broke here.

Here is a sample document, it is simple JSON (without indentation), and it isn’t terribly large:

image

The problem happens when we convert it to a .NET object:

image

Yep, when we de-serialized it, it takes close to 13 times more space than the text format.

For fun, let us take the following JSON:

image

This generates a string whose size is less than 1KB.

But when parsing it:

image

The reason, by the way? It is the structure of the document.

The reason, by the way:

image

So each two bytes for object creation in JSON ( the {} ) are holding, we are allocating 116 bytes. No wonder this blows up so quickly.

This behavior is utterly dependent on the structure of the document, by the way, and is very hard to protect against, because you don’t really have a way of seeing how much you allocated.

We resolved it by not only watching the size of the documents that we are reading, but the amount of free memory available on the machine (aborting if it gets too low), but that is a really awkward way of doing that.  I’m pretty sure that this is also something that you can use to attack a server, forcing it to allocate a lot of memory by sending very little data to it.

I opened an issue on the CoreCLR about this, and we’ll see if there is something that can be done.

In RavenDB 4.0, we resolved that entirely by using the blittable format, and we have one-to-one mapping between the size of the document on disk and the allocated size (actually, since we map, there is not even allocation of the data, we just access it directly Smile).

time to read 4 min | 781 words

This little nugget has caused a database upgrade to fail. Consider the following code for a bit. We have CompoundKey, which has two versions, slow and fast. The idea is that we use this as keys into a cache, and there are two types because we can “query” the cache cheaply, but constructing the actual key for the cache is more expensive. Hence, the names.

public class CompoundKey
{
    public int HashKey;

}

public sealed class FastCompoundKey : CompoundKey
{
    public int Val;

}

public sealed class SlowCompoundKey : CompoundKey
{
    public int SlowVal;

}
public class CompoundKeyEqualityComparer : IEqualityComparer<CompoundKey>
{
    [MethodImpl(MethodImplOptions.AggressiveInlining)]
    public bool Equals(CompoundKey x, CompoundKey y)
    {
        if (x == null || y == null)
            return false;

        SlowCompoundKey k;
        FastCompoundKey self;
        var key = x as FastCompoundKey;
        if (key != null)
        {
            self = key;
            k = y as SlowCompoundKey;
        }
        else
        {
            self = y as FastCompoundKey;
            k = x as SlowCompoundKey;
        }

        return self.Val == k.SlowVal;
    }

    [MethodImpl(MethodImplOptions.AggressiveInlining)]
    public int GetHashCode(CompoundKey obj)
    {
        return obj.HashKey;
    }
}

The problem was a null reference exception in the Equals method.  And I believe the term for how I felt was:

The problem is that it is obvious why a null reference exception can be thrown. If the values passed to this method are both SlowCompoundKey or both FastCompoundKey. But the reason the Equals method looks the way it does is that this is actually in a very performance sensitive portion of our code, and we have worked to make sure that it runs as speedily as possible. We considered the case where we would have both of them, but the code had a measured performance impact, and after checking the source of the dictionary class, we were certain that such comparisons were not possible.

We were wrong.

Boiling it all down, here is how we can reproduce this issue:

 var dic = new Dictionary<CompoundKey, object>(new CompoundKeyEqualityComparer());
 dic[new SlowCompoundKey { HashKey = 1 }] = null;
 dic[new SlowCompoundKey { HashKey = 1 }] = null;

What is going on here?

Well, it is simple. We add another value with the same hash code. That mean that the dictionary need to check if they are the same value, or just a hash collision. It does so by passing both the first key (slow) and the second key (slow) into the Equals method, and then hilarity enthused.

In retrospect, this is pretty much how it has to behave, and we should have considered that, but we were focused on looking at just the read side of the operation, and utterly forgot about how insert must work.

Luckily, this was an easy fix, although we still need to do regressive perf testing.

time to read 5 min | 930 words

Unlike previous posts in this series, this is actually something that happened to our own production server today. It resulted in our website being inaccessible for a a couple of hours, and like most such stories, its root cause is tremedously simple, and through a series of unfortunate accidents, it had escalated to a major issue.

First, this post is dedicted to this book, which should be read by any self respecting developer whose code is expected to hit production.

Cover image for Release It!

This post is also written a few hours only after the incident was resolved. Before we actually implemented anything except a temporary workaround. I’ll probably have another post in a couple of days to talk about the steps we are going to take to alleviate a repeat of this incident.

The incident started innocently enough, when one of the guys on the team discovered that the startup time of a certain instance jumped by a lot. Investigating into why he realized that the issue was extremely slow responses from our server. That was a cause of triple concern, actually. First, why are we accepting such slow responses instead of time limiting them? Second, why are we making a remote syncronous call during startup? And third, why on Earth is our server so slow?

Logging into the server, it didn’t take long to see what the problem was. The www.RavenDB.net website (the code that runs the RavenDB website, not RavenDB itself) was consuming a lot of CPU and quite a bit of memory. In a bit to restore the other services which reside on the same box, we reset the process. Our main concern at the time was to restore service as soon as possible, and we planned on investigating further through the logs.

However, in a few minutes, the www.RavenDB.net website started consuming more and more resources. At that point, we started considering a DoS attach of some sort and looked a the logs. The logs did show a very high number of requests, much more than I would expect. But looking further into them, it looked like they were mostly bots of various kinds indexing our site.

Considering that this might be the case of Google hammering us, we configured a robots.txt on the site and waited to see if this would have an impact. It didn’t.

The next step was to take a process dump of the process, and then analyze it. During this period, we had to shut down www.RavenDB.net because it was killing all other services running on the server.

Looking at the dump in WinDBG, we started with the obvious commands.

  • !runaway – to find out the thread cpu times
  • switching to the busiest threads
  • !clrstack - to see what it is doing

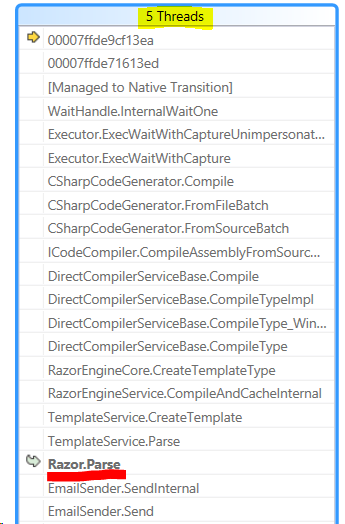
Honestly, this is a much nicer way of looking at this, though:

image

As you can see, the threads are currently actually doing parsing of a Razor template, and seems to be doing that on a fairly continous basis, consuming all system resources.

At that point, I started getting concerned to the well being of the poor guy’s inbox as a result of this code. That was the point where we actually did what should have probably been our first action, and looked at the error log of the website.

Previously, we looked at the live metrics and the request log, but didn’t consider looking into the error log for the system. The error log for the website, for today only, was 6GB in size, and was pretty full of errors such as:

- error: (221, 88) 'HibernatingRhinos.Orders.Common.EmailProcessing.EmailTemplates.RavenDBWebsite.Models.DownloadQuestionMailInput' does not contain a definition for 'Unsubscribe' and no extension method 'Unsubscribe' accepting a first argument of type

And at that point, we had enough to point a suspicious finger. We have an email that we send out, and we used to have a valid template. At some point, the code was changed and the Unsubscribe was removed. Nothing broke because the template is just a file, not actually compiling code. However, in production, when we tried to send the email, Razor would parse the text, fail compilation because of the missing member, and basically thorw a hissy fit.

Update: We investigated further, and it looks like the following was the actual “solution” to the outage:

image

The “solution” is in quotes, becasue this fixes the problem, but we need to still implement steps to ensure that something like that doesn’t repeat.

Unforuntately, at that point, we would consider this email as failing, and move on to the next one. That next one would also fail, and so would the next one, etc. Because all of them failed, they would get picked up again next time this run.

Once we knew where the problem was. The workaround was to deploy a version with no email sending. For this weekend, that will work. But come Sunday, someone is going to go over this piece of code with a veyr fine comb. I’ll post more about it once this actually roll around.

time to read 4 min | 661 words

A customer called with a major issue, on a customer machine, a particular operation took too long. In fact, it takes quite a bit more than too long. Instead of the few milliseconds or (at worst, seconds), the customer saw a value in the many minutes.

At first, we narrowed it down to an extreme load on the indexing engine. The customer had a small set of documents that were referenced using LoadDocument by large number of other documents. That meant that whenever those documents were updated, we would need to reindex all the referencing documents.

In their case, that was in the tens to hundreds of thousands of referencing documents in some cases. So an update to a single document could force re-indexing of quarter million documents. Except… that this wasn’t actually the case. What drove everyone crazy was that here was a reasonable, truthful and correct answer. And on one machine the exact same thing took 20 – 30 seconds, and on the customer machine the process took 20 minutes.

The customer also assured us that those documents that everyone referenced are very rarely, if at all, touched or modified, so that shouldn’t be the issue.

The machine with the problem was significantly more powerful from the one without the problem. This issue also started to occur recently, out of the blue. Tracing the resource utilization in the system showed moderate CPU usage, low I/O and memory consumption and nothing much really going on. We looked at the debug logs, and we couldn’t really figure out what it was doing. There were very large gaps in the log where nothing seems to be happening. % Time in GC was low, so that ruled out a long GC pause that would explain the gap in the logs.

This is in version 2.5, which predates all of our introspection efforts, so figuring out what was going on was pretty hard. I’ll have another post talking about that in this context later.

Eventually we gained access to the machine and was able to reproduce this, and take a few mini dumps along the way. Looking at the stack traces, we found this:

image

And now it all became clear. Suggestions in RavenDB is a really cool feature, which allows you to ask RavenDB to figure out what the user actually meant to ask. It is also extremely CPU intensive during indexing, which is really visible when you try to pump large number of documents through it. And it is a single threaded process.

Except that the customer wasn’t using Suggestions in their application…

So, what happened, in order to hit this issue the following things all needed to happen:

  • Suggestions to be enabled on the relevant index/indexes. Check while the customer wasn’t currently using it, they were using it in the past, and unfortunately that stuck.
  • A very large number of documents need to be indexed. Check – that happened when they updated one of the commonly referenced documents.
  • A commonly referenced document needed to be modified. Check – that happens when they started work for next year, which modified those rarely touched documents.

Now, why didn’t it manifest itself on the other machines? Simple, on those machines, they used the current version of the application, which didn’t use suggestions. On the machines that were problematic, they upgraded to the new version, so even though they weren’t using suggestions, that was still in affect, and still running.

According to a cursory check, those suggestions has been running there for over 6 months, and no one noticed, because you needed the confluence of all three aspects to actually get this issue.

Removing the suggestions once we know they were there was very easy, and the problem was resolved.

FUTURE POSTS

No future posts left, oh my!

RECENT SERIES

  1. Production postmorterm (2):
    11 Jun 2025 - The rookie server's untimely promotion
  2. Webinar (7):
    05 Jun 2025 - Think inside the database
  3. Recording (16):
    29 May 2025 - RavenDB's Upcoming Optimizations Deep Dive
  4. RavenDB News (2):
    02 May 2025 - May 2025
  5. Production Postmortem (52):
    07 Apr 2025 - The race condition in the interlock
View all series

Syndication

Main feed Feed Stats
Comments feed   Comments Feed Stats
}