Oren Eini

CEO of RavenDB

a NoSQL Open Source Document Database

Get in touch with me:

oren@ravendb.net +972 52-548-6969

Posts: 7,584
|
Comments: 51,220
Privacy Policy · Terms
filter by tags archive
time to read 6 min | 1057 words

A customer called to complain that the indexing times that they were seeing on an index rebuild were very high, and that caused them issues. The customer was kind enough to actually provide us with a duplicate machine of their system, including duplicate data, which made the whole process so much easier. Unlike most scenarios, where we have to poke the logs, the debug endpoints and to try to figure out what is going on in a production system that we can’t really touch without causing downtime, here we had a complete freedom of action during the investigation.

The database in question is in the many tens of GB in size, and like most production databases, it has its own.. gravity, shall we say? Unlike a test data set where you can do something over the entire set and get immediate return, here the problem often was that to reproduce the issue we’ll have to start the action, then wait for ten or twenty minutes for it to pick up steam and actually start exhibiting the problem. But being able to actually run those tests repeatedly was very valuable in both narrowing down on exactly what was going on and how to resolve it.

The problem boiled down to an issue with how we were handling document prefetching. Before I get down into the details of that, let me explain what prefetching is.

Quite a lot of RavenDB code is concerned with reducing the time a request has to spend waiting for I/O. In particular, creation of a new index require us to read all the documents in the database so we can index them. On large databases, that can mean that we need to read tens of GB (and on very large databases, running an index that cover half a TB is very likely) from disk, index them, then write the index results to disk again.

Initially (as in, five or six years ago), we wrote the indexing code like so:

  • while (there are documents to index):
    • Load a batch of documents
    • Index those documents
    • Write them to disk

The problem is that this kind of code is very simple an easy to understand, but it also results in spending a lot of time doing:

  • Wait for load documents (no CPU usage)
  • Index documents (CPU usage)
  • Wait to write to disk (no CPU usage)

So a lot of the time was spent just waiting for I/O. Time that could have been much better spent doing something useful.

Because of that, we introduced the idea of prefetching. Basically, whenever we finish loading stuff from disk, we also immediately start a background task that will read the next batch of documents to member. The idea is that while we are indexing / writing the index results to disk, we’ll load the next batch of documents to memory, and we’ll have them immediately available to the indexing code, so we’ll have to do less waits, and we get the benefit of parallel I/O and execution.

This is a really high level overview of what is going on there, of course, and we need to balance quite a few competing concerns (memory, I/O pipeline size, I/O speed, other work being done, CPU utilization, etc, etc). But that is a pretty good description.

The problem in this case was that the customer in question have the following pattern of documents:

image

Our code mostly assumes that you have a roughly uniform distribution of documents sizes. Given the distribution above, assume we have a batch size of 2.

We’ll read the first two documents (taking 25Kb), and then start indexing them. At this time we start loading the next 2 documents. But the msgs/4 document is large, so it takes time to load, which means that indexing is now stalled on I/O.

What is work, the problem exacerbated, since the bigger documents tended to be toward the end (later documents tend to be bigger), it means that our heuristics about the data kept misleading us. Now, to make things worse, we actually do care about the size of the documents that we load, so instead of indexing the documents in big batches, those big documents would cause both I/O stalls, and then cause us to send much smaller batches to the indexes. That means that we have a lot more indexing batches, and a lot more I/O stalls.

The solution was to allow the prefetching code to give the indexes “whatever I have on hand”, and then continue with prefetching the additional documents while the indexes are working. It means more batches, but far less time waiting for the documents to be loaded from disk.

Another change we did was to parallelize the I/O further. When we notice that we get into this kind of situation, instead of firing off a single background task to load the next document batch, we are actually going to spin off multiple prefetching tasks, to load the next few batches in parallel. That means that we put more load on the I/O system, but especially on cloud machines, that is actually a  good thing (they they to have a shallow but wide I/O behavior).

Here the ability to actually test those changes on real system was invaluable, because our initial attempt was a bit… too active and actually placed serious I/O strain on the system, because we would try to make a lot of parallel reads for a lot of data at the same time. The implementation that we ended up with knows to scale the amount of pressure we put on the I/O system based on the actual system we use, the (current) I/O throughput we see, the document sizes in recent history, etc.

The end result is that we were able to shave about 20% – 25% of the indexing time under those conditions, and keep the system alive and functioning while we are doing so.

We also introduced the customer to the side by side, which allows them to deploy indexes in production without any interruption in service while the indexing is rebuilding. 

time to read 4 min | 635 words

We got an error report from a customer about migration issue from 2.5 to 3.0. A particular document appear to have been corrupted, and caused issues.

We have an explicit endpoint to expose the database raw bytes to the client, so we can troubleshoot exactly those kind of errors. For fun, this is a compressed database, so the error was hiding beneath two level of indirection, but that is beside the point.

When looking at the raw document’s byte, we saw:

image

Which was… suspicious. It took a while to track down, but the end result was that this error would occur when you have:

  • A large string (over 1KB), and it is the first large string in the document.
  • At the 1023 position of the string (bytewise), you have a multi byte and multiple character value.

In those cases, we wouldn’t be able to read the document.

The underlying reason was an optimization we made in 3.0 to reduce buffer allocations during deserialization of documents. In order to properly handle that, we used an Encoding Decoder directly, without any intermediate buffers. This works great, except in this scenario, and the way JSON.Net calls us.

When JSON.Net find a large string, it will repeatedly read characters from the stream until it reached the end of the stream, and only then it will process it. If the string size is more than the buffer size, it will increase the buffer.

Let us imagine the following string:

ABC

When we serialize it, it looks like this:

var bytes = new byte[] { 65, 66, 67, 0xF0, 0x9F, 0x92, 0xA9 };

And let us say that we want to read that in a buffer of 4 characters. We’ll use it like so:

 int bytesPos = 0;
 int charsPos = 0;
 var chars = new char[4];
 while (bytesPos < bytes.Length) // read whole buffer
 {
    while (charsPos < chars.Length) // process chars in chunks
     {
         int bytesUsed;
         int charsUsed;
         bool completed;
         decoder.Convert(bytes, bytesPos, bytes.Length - bytesPos, chars, charsPos, chars.Length - charsPos, false,
             out bytesUsed, out charsUsed, out completed);
         bytesPos += bytesUsed;
         charsPos += charsUsed;
     }
     Console.WriteLine(new string(chars));
 }

On the first call, the Convert will convert the first three bytes into three characters, and stop. The JSON.Net code will then ask it to fill to the end of the buffer (simulated by the inner loop), but at that point, the Convert method will throw, because it has just one character available in the buffer to write to, but it can’t write that character.

Why is that? Look at the poo string above. How many character does it take?

If you answered four, you are correct visually, and wrong in buffer sense. This string actually takes 5 characters to represent. As I mentioned, in order to hit this error, we have to had a particular set of things align just right (or wrong). Even a single space difference would align things so no multi byte character would span the 1KB boundary.

The solution, by the way, was to drop the optimization, sadly, we’ll revisit this at a later time, probably, but now we’ll have a way to confirm that this scenario is also covered.

time to read 1 min | 100 words

The following is a really good study on real world production crashes:

Simple Testing Can Prevent Most Critical Failures:
An Analysis of Production Failures in Distributed
Data-Intensive Systems

It makes for fascinating reading, especially since the include the details of the root cause of some of the errors. I wasn’t sure whatever to cringe or sympathize Open-mouthed smile.

image

time to read 4 min | 609 words

While studying an issue using customer data, I noticed that indexing speed wasn’t up to what I expected it to be. In fact, the size of the indexing batch remained roughly constant (and small), and didn’t exhibit the usual increases as RavenDB notices that the server has a lot of work to do and the resources to do it. This was while investigating something else, but since I had to re-index that database quite a few time, I decided to investigate what was going on.

The underlying issue turned out to be a configuration setup. An index was specified with a MaxNumberOfOutputsPerDocument of 55. We use this value for a few things, among them to ensure to manage the memory resulting from indexing operations. In particular, we have had some issues with indexes that output a large number of index entries per documents using more then the quota allocated to the index and generating (sometime severe) memory pressure.

Unfortunately, in this case, we had the other option. The index was configured properly, but the index didn’t actually output multiple entries. So we ended up assuming that the index would generate a lot more memory than it would actually really use. That meant that we couldn’t feed it larger batches, because we feared it would use too much memory…

The fix was to make effectively ignore this value. Instead of using the value assuming that the user knows what is going it, we’ll use this value as the maximum value only, and use heuristics to figure out how much memory we should reserve for the index in question.

This is a smaller example of a wider issue. The values that the system gets are user input. And they should be treated as such. This means that you need to validate them in the same sense you would validate any other input from users.

In the case outlined above, the only implication was that we would index a more slowly, and weren’t able to take full advantage of the machine resources we had available. There have been other such issues.

An administrator has setup a set of range values so the min value was larger than the max value. This turned out to cause us to have no effective limit, short of an integer overflow. The end result was that we would use unbounded memory for our needs, which would work, most of the time, except when you had a big set of changes to apply and we would try to do it all at once…

Another case was an ops guy that wanted to reduce RavenDB CPU usage, so he set the number of threads available for background work to 0. That meant that work that was queued on background threads would never complete, and the system would effectively hang.

You get the drift, I assume.

Your configuration file (or however you are actually configuring things) is yet another way for your user to communicate with your application. Sure, the tone is much stricter (commanding, rather than asking), but you still need to make sure that what the user is asking you to do actually make sense. And if it doesn’t, you need to decide what to do about it.

  • You can exit the process. The “I can’t work with you people” mode of error handling.
  • You can emit a warning and proceed. The “I told you so, buster!” motto of blame shifting.
  • You can ignore the set value. The “I know better than you” school of thought.

There aren’t really good choices, especially for server applications that can’t just show an error to the user.

time to read 9 min | 1628 words

This is a recent case. One of our customers complained that every now and then they started to see very high memory utilization, escalating quickly until the system would bog down and die. They were able to deploy a mitigation strategy of a sort, when they detected this behavioral pattern, they would force RavenDB to reject client requests for a short while, which would fix this issue.

imageThis went on for  a while, because the behavior was utterly random. It didn’t seem to relate to load, peek usage time on the system didn’t correlate to this in any way. Eventually the customer raised another issue, that a certain spatial query was behaving very slowly in the logs.

We tested that, and we found that the customer was correct. More properly, the query executed just fine when run independently. But when we run this query tens or hundreds of times concurrently, we will see very high response times (and getting worse), and we would see the server memory just blowing up very quickly. So we have a memory leak, we figured out, let us see what is going on… We dumped the data, and tried to figure out what it was exactly that we were leaking.

But there wasn’t anything there!

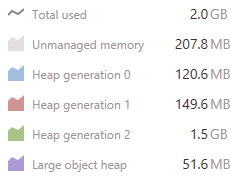
In fact, looking at the problem, it became even curiouser.  Take a look at what we saw during one of the test runs:

image

Note that this is all running with no other work, just a lot of queries hitting the server.

Somehow, we had a lot of data going into the Gen2 heap. But when we checked the Gen2, it was pretty much empty. In fact, we had a 100% fragmentation. Something was very strange here. We enabled memory allocation tracking and started to look into what was going on. We found this very suspicious (note that this is from a different run from the one above):

image

So FileStream.Read is allocating GBs over GBs of memory? What is going on?! It took a while to figure out what was going on. The underlying issue was within Lucene. Actually, an intersection of a few things inside Lucene.

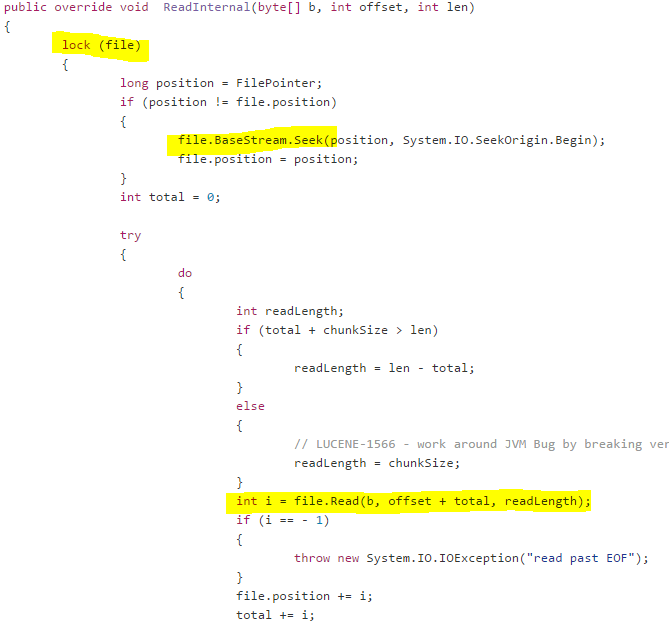
Here is how Lucene reads from a file on disk:

image

What you’ll notice is that Lucene is holding a lock on the file, and then issuing I/O. In other words, it is going to hold that lock for a while. This is a very strange thing to do, why is Lucene doing it?

It does this because of a strange decision on how to do concurrent I/O.

image

Basically, whenever Lucene needs to do concurrent I/O, it will clone the relevant input object, and then use it concurrently. The idea, I gather, is that Lucene didn’t want to have a separate file handle for each multi threaded operation, instead it created one file handle, and used it concurrently. Since concurrent I/O takes careful usage, they slapped a lock on it and call it a day. I’m being unfair, I know, this is explicitly called out in the docs:

image

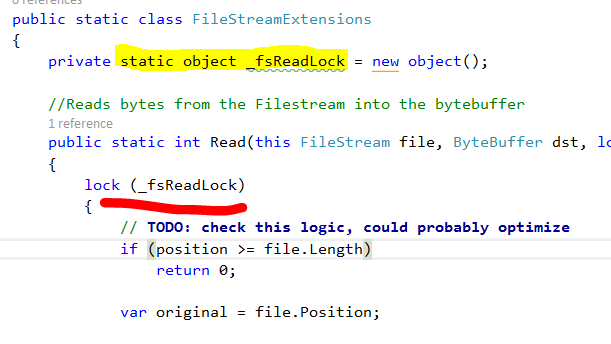
And in the Java version, there is an NIOFSDirectory that is presumably much better. Such doesn’t exist in the Lucene.Net version we are using. In fact, I was curious and I checked the upcoming version, they do have a NIOFSDirectory implementation, which had the following code in it:

image

This is a single global lock for everything. Thank you, I’ll take the lock per file. Now, to be fair again, work in progress, etc.

We noticed this issue a long while ago, and we solved it by using multiple FileStreams. It used more resources, but it meant that we were far more concurrent. Note that all of this actually happened years ago, and we had no problems in this area. Note that Linux program typically worry a lot more about the number of open file handles than Windows programs do.

The problem was definitely related to the use of multiple FileStream. But it didn’t have anything to do with holding multiple handles to the same file. Instead, the issue was in the usage pattern that the query exhibited.

In particular, and I’m going to get deep into Lucene here, the problem was inside the SegmentReader.Terms() method:

image

This seem innocuous, right? Here is how this is implemented:

image

And all the way down until we gets to the input.Clone() method. Now, in a standard Lucene system, using concurrent queries, this would result in a fair amount of locking. In RavenDB, this just meant that we were creating new FileStream objects.

The problem was that this particular query had a list of terms that it needed to check, and it called the Terms() method many times. How much is many times? 12,000 times!

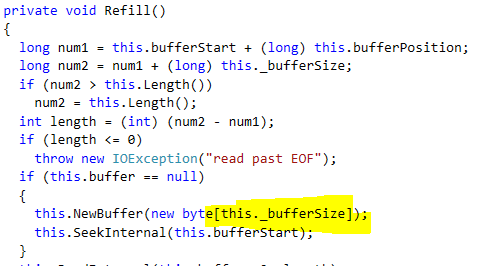
Still not a problem, except that it called FileStream.Read on each and every one of those. And FileStream.Read does the following:

image

And the _bufferSize is set to the default of 4KB.

In other words, processing a single instance of this particular query will result in the system allocating about 48MB of memory!

And when we have concurrent queries of this type? Each of them is allocating 48 MB of memory, and because they allocate so much, we have GC runs, which cause the memory (which is still in use) to be sent to Gen 1, and eventually park in Gen 2. There is languish (because it is temporary memory, but we don’t clear Gen 2 very often).

We changed the implementation to use overlapped I/O and tested that, and the memory consumption dropped by a significant number. But we still saw more allocations than we liked. We ended up tracking that down the this call (in BufferedIndexInput  in the Lucene codebase):

image

The buffer size in this case is 1KB. So allocation for this query was actually 60 MB(!), and we only managed to drop it by 48MB.

After fighting with this for a long while, we ended scratch the whole buffered index input idea. It is just not sustainable in terms of allocations. Instead, we created a memory map input class, that map the input data once, and doesn’t use a buffer (so no allocations). With that option, our cost to process this query was drastically lower.

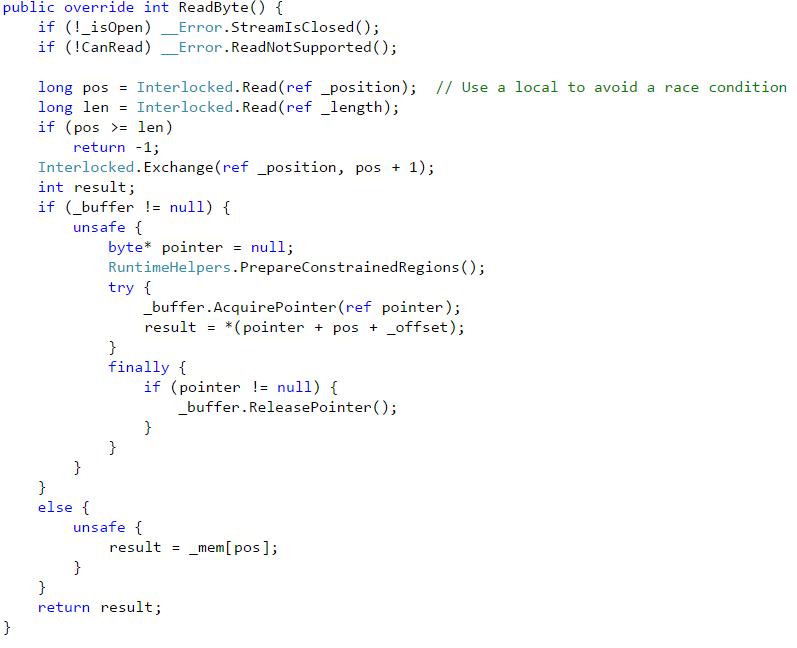
We profile the change, to see whatever there are additional issues, and we found that the newly optimized code was much better, but still had an issue. The memory map code used the UnmanagedMemoryStream class to expose the file to the rest of the application. Unfortunately, this class appears to be intended for concurrent usage, which is a rarity for Streams. Here is ReadByte method from that class:image

As you can see, this method is doing quite a lot. And it showed up as a hot spot in our profiling. The rest of the class is pretty complex as well, and does significantly more than what we actually need it to do.

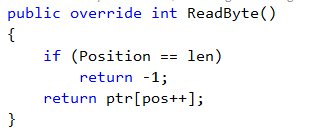
We replaced this with a MmapStream class, and here is the comparable implementation.

image

You can safely assume that this is much faster Smile.

We have tested this using 5000 concurrent requests, without caching. Memory consumption is steady, and doesn’t increase. We show marked improvement across the board, in memory utilization, CPU usage and I/O rates. Note that while this issue was caused by a particular query whose pattern of operation caused tremendous number of allocations, this change has wider reaching implications.

We now allocate less memory for all queries, and previous experience has shown us that reducing a single 4Kb allocation in query processing can improve overall performance but 30%. We haven’t run those tests yet, but I’ll be surprised if we’ll see negative results.

time to read 3 min | 553 words

One of the most frustrating things when you dealing with production issues is when the problem is not in our product, but elsewhere. In particular, this post is dedicated to the hard work done by many anti virus products, in particular, to make our life harder.

Let us take a look at the following quote, taken from the ESET NOD32 Anti Virus knowledge base (emphasis mine):

By default, your ESET product automatically detects programs that are used as web browsers and email clients, and adds them to the list of programs that the internal proxy scans. This can cause loss of internet connectivity or other undesired results with applications that use network features but are not web browsers/email clients.

Yes, it can. In fact, it very often does.

Previously, we looked at a similar issue with Anti Virus slowing down I/O enough to cause us to slowly die. But in this case, the issue is a lot more subtle.

Because it is doing content filtering, it tends to put a much higher overhead on the system resources, which means that as far as the user is concerned, RavenDB is slow. We actually developed features specifically to handle this scenario. The traffic watch mode will tell you how much time you spend on the server side, and we have added a feature that will make RavenDB account for the internal work each query is doing, so we can tell where the actual cost is.

You can enable that by issuing:

GET databases/Northwind/debug/enable-query-timing

And one that is setup, you can get a good idea about what is costly in the query, as far as RavenDB is concerned. Here is an example of a very slow query:

image

You can see that the issue is that we are issuing a very wide range query, so most of the time is spent in inside Lucene. Other examples might be ridicilously complex queries, which result in high parsing time (we have seen queries in the hundreds of KB range). Or loading a lot of big documents, or… you get the drift. If we see that the server thinks that a query is fast, but the overall time is slow, we know to blame the network.

But an even more insidious issue is that this would drop requests,  consistently and randomly (and yes, I know that those are contradictions, it was consistently dropping requests in a random pattern that seemed explicitly designed to thwart figuring out what is going on). Leading to things breaking, and escalated support calls. “RavenDB is broken” leads to a lot of headache, and a burning desire to hit something when you figure out that not only isn’t it your fault, but the underlying reason is actively trying to prevent you from figuring it out (I assume it is to deal with viruses that try to shut it off), which lead to really complex find facting sessions.

That is more annoying because it seems that the issue there was a bug in respecting keep alive sessions for authenticated requests under some scenarios, in the AV product in question! Absolutely not fun!

time to read 4 min | 776 words

One of the hardest practices to learn as a developer is to actually sit down and read the information that you have. Ever since we became a product company, we have to deal with partial information, because some data wasn’t captured, or it isn’t possible to capture more information because it is running in a production environment.

That means that we have to do the most with the information we have available. Here are a few recent cases of having information, and ignoring it. A customer complained that a query was timing out. He provided the following error.

{"Url":"/databases/Events/streams/query/
EventsByTimeStampAndSequenceIndex?&start=9134999&sort=EventTimeStamp&sort=EventSequence_Range&SortHint-
EventTimeStamp=String&SortHint-EventSequence_Range=Long","Error":"System.OperationCanceledException: The operation 
was canceled.\r\n   at System.Threading.CancellationToken.ThrowIfCancellationRequested()\r\n   at Raven.Database.
Indexing.Index.IndexQueryOperation.<Query>d__5d.MoveNext()\r\n   at Raven.Database.Util.ActiveEnumerable`1..ctor(
IEnumerable`1 enumerable)\r\n   at Raven.Database.Actions.QueryActions.DatabaseQueryOperation.Init()\r\n   at Raven
.Database.Server.Controllers.StreamsController.SteamQueryGet(String id)\r\n   at lambda_method(Closure , Object , 
Object[] )\r\n   at System.Web.Http.Controllers.ReflectedHttpActionDescriptor.ActionExecutor.<>c__DisplayClass10.<
GetExecutor>b__9(Object instance, Object[] methodParameters)\r\n   at System.Web.Http.Controllers.
ReflectedHttpActionDescriptor.ExecuteAsync(HttpControllerContext controllerContext, IDictionary`2 arguments, 
CancellationToken cancellationToken)\r\n--- End of stack trace from previous location where exception was thrown 
---\r\n   at System.Runtime.CompilerServices.TaskAwaiter.ThrowForNonSuccess(Task task)\r\n   at System.Runtime.
CompilerServices.TaskAwaiter.HandleNonSuccessAndDebuggerNotification(Task task)\r\n   at System.Runtime.
CompilerServices.TaskAwaiter`1.GetResult()\r\n   at System.Web.Http.Controllers.ApiControllerActionInvoker.<
InvokeActionAsyncCore>d__0.MoveNext()\r\n--- End of stack trace from previous location where exception was thrown 
---\r\n   at System.Runtime.ExceptionServices.ExceptionDispatchInfo.Throw()\r\n   at System.Runtime.
CompilerServices.TaskAwaiter.ThrowForNonSuccess(Task task)\r\n   at System.Runtime.CompilerServices.TaskAwaiter.
HandleNonSuccessAndDebuggerNotification(Task task)\r\n   at System.Runtime.CompilerServices.TaskAwaiter`1.
GetResult()\r\n   at System.Web.Http.Controllers.ActionFilterResult.<ExecuteAsync>d__2.MoveNext()\r\n--- End of 
stack trace from previous location where exception was thrown ---\r\n   at System.Runtime.ExceptionServices.
ExceptionDispatchInfo.Throw()\r\n   at System.Runtime.CompilerServices.TaskAwaiter.ThrowForNonSuccess(Task 
task)\r\n   at System.Runtime.CompilerServices.TaskAwaiter.HandleNonSuccessAndDebuggerNotification(Task 
task)\r\n   at System.Runtime.CompilerServices.TaskAwaiter`1.GetResult()\r\n   at System.Web.Http.Controllers.
ExceptionFilterResult.<ExecuteAsync>d__0.MoveNext()"}

As you can see, that is a big chunk of text, and it require careful parsing. I’m actually quite proud of this, even though the error is obtuse, it is giving us all the information that we need to figure out what the problem is.

In particular, there are two pieces of information that we need to see here:

  • OperationCancelledException is thrown when we have a timeout processing the query on the server side.
  • start=9134999 is a request to do deep paging of about 10 million records, and then start reading.

Those two combine tell us that the issue is that we are doing deep paging, which cause us to timeout internally before we start sending any data.

But why are we timing out on deep paging? What is expensive about that?

Turns out that RavenDB does de-dup during queries. So if you got events/1 in page #1, you won’t see it in page #2 even if there are results from the index for that document in page #2. If you care to know more, the issue is related to fanout and one document having many index entries pointing to it. But the major issue here is that we need to scan 10 million docs to avoid duplicates before we can return any value to the user. There is a flag you can send that would avoid this, but that wasn’t used in this case.

Another issue that was solved by reading the message from the customer was:

Message
Version store out of memory (cleanup already attempted)
 
Exception
Microsoft.Isam.Esent.Interop.EsentVersionStoreOutOfMemoryException: Version store out of memory (cleanup already attempted) 
at Raven.Database.Storage.Esent.StorageActions.DocumentStorageActions.RemoveAllBefore(String name, Etag etag) in c:\Builds\RavenDB-Stable-3.0\Raven.Database\Storage\Esent\StorageActions\Lists.cs:line 74
at Raven.Database.Smuggler.SmugglerEmbeddedDatabaseOperations.<>c__DisplayClass12.<PurgeTombstones>b__11(IStorageActionsAccessor accessor) in c:\Builds\RavenDB-Stable-3.0\Raven.Database\Smuggler\SmugglerEmbeddedDatabaseOperations.cs:line 219
at Raven.Storage.Esent.TransactionalStorage.ExecuteBatch(Action`1 action, EsentTransactionContext transactionContext) in c:\Builds\RavenDB-Stable-3.0\Raven.Database\Storage\Esent\TransactionalStorage.cs:line 799 at Raven.Storage.Esent.TransactionalStorage.Batch(Action`1 action) in c:\Builds\RavenDB-Stable-3.0\Raven.Database\Storage\Esent\TransactionalStorage.cs:line 778
at Raven.Abstractions.Smuggler.SmugglerDatabaseApiBase.<ExportData>d__2.MoveNext() in c:\Builds\RavenDB-Stable-3.0\Raven.Abstractions\Smuggler\SmugglerDatabaseApiBase.cs:line 187 --- End of stack trace from previous location where exception was thrown ---
at System.Runtime.CompilerServices.TaskAwaiter.ThrowForNonSuccess(Task task) at System.Runtime.CompilerServices.TaskAwaiter.HandleNonSuccessAndDebuggerNotification(Task task)
Reported
25 minutes ago (08/02/15, 9:43am)
Level
Error

Version store out of memory happens when the size of the uncommitted transaction is too large, and we error. Usually that indicate some unbounded operation that wasn’t handled well.

Those are almost always batch operations of some kind that do various typed of cleanups. In order to handle them, we are pulsing the transaction. Effectively committing the transaction and starting a new one. That frees the uncommitted values.

The problem was that this method had this behavior:

image

So the investigation was focused on why MaybePulseTransaction didn’t work properly. There is some heuristics there to avoid being too costly, so it was very strange.

Can you see the error? We were looking at the wrong overload, this is the one that takes a time, and the one that was called takes an etag. Indeed, in the version the customer had, that call wasn’t there. In the current version, it was added.

Knowing how to read errors and logs, and actually paying attention to what they are saying is crucial when the time to fix a problem is at hand.

time to read 3 min | 496 words

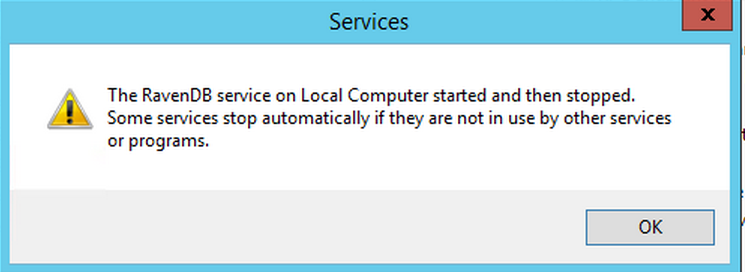
A customer gave us a call about a failure they were experiencing in their production environment. They didn’t install the license that they purchased for some reason, and when they tried to install that, RavenDB will not run.

There is what this looked like:

image

Once I had all those details, it was pretty easy to figure out what was going on. I asked the client to send me the Raven.Server.exe.config file, just to verify it, and sure enough, here are the problematic lines:

<add key="Raven/AnonymousAccess" value="Admin"/>
<add key="Raven/Licensing/AllowAdminAnonymousAccessForCommercialUse" value="false" />

This is the default configuration, and this failure is actually the expected and desired behavior.

What is going on? This customer was running RavenDB in a development mode, without a license. That means that the server is open to all. When you install a license, that is a pretty strong indication that you are using RavenDB in production. It is actually common to see users installing the development mode in production, and registering the license at a later date, for various reasons.

The problem with that is that this means that at least for a while, they were running with “everyone is admin” mode, which is great for development, but horrible for production. If you install RavenDB for production usage (by providing a license during the setup process), it will set itself up in locked down mode, so only users explicitly granted access can get to it. But if you started at development installation, then added the license…

It is common for customers to forget or actually be unaware of that setting. And not setting it is going to end up with a production installation that is open to the whole wide world.

When that happens, that tend to be… bad. Over 30,000 instances that are wide open bad.

Because of that, if you are running a license, and you had previously installed the development mode, you need to make a choice. Either you setup anonymous access so only authorized people can access the database, or you explicitly decided to grant everyone access, likely because you are already running in secured environment.

Error reporting from services is a bit hard, because there is no good way to send error messages to the service managers. But in the event log, we can see the actual error with the full details.

image

time to read 4 min | 785 words

This one is a pretty recent one. A customer complained about high memory usage in RavenDB under moderate usage. That was a cause for concern, since we care a lot about our memory utilization.

So we started investigating that, and it turned out that we were wrong, the problem wasn’t with RavenDB, it was with the RavenDB Client Library. The customer had a scenario where 100% of the time, after issuing a small number of requests (less than ten), the client process would be using hundreds of MB, for really no purpose at all. The client already turned off caching, profiling and pretty much anything else that both they and us could think of.

We got a process dump from them and looked at that, and everything seemed to be fine. The size of the heap was good, and there didn’t appear to be any memory being leaked. Our assumption at that point was that there is some sort of native memory leak from their application.

To continue the investigation further, NDAs was required, but we managed to go through that and we finally had a small repro that we could look at ourselves. The fact that the customer was able to create such a thing is really appreciated, because very often we have to work with a lot of missing information. Of course, when we run this on our own system, everything was just fine & dandy. There was no issue. We got back to the customer and they told us that the problem would only reproduce in IIS.

And indeed, once we have tested inside IIS (vs. using IIS Express), that problem was immediately obvious. That was encouraging (at least from my perspective). RavenDB doesn’t contain anything that would differentiate between IIS and IIS Express. So if the problem was only in IIS, that is not likely to be something that we did.

Once I had a repro of the problem, I sat down to observe what was actually going on. The customer was reading 1,024 documents from the server, and then sending them to the browser. That meant that each of the requests we tested was roughly 5MB in size. Note that this means that we have to:

  • Read the response from the server
  • Decompress the data
  • Materialize it to objects
  • Serialize the data back to send it over the network

That is a lot of memory that is being used here. And we never run into any such issues before.

I had a hunch, and I created the following:

[RoutePrefix("api/gc")]
public class GcController : ApiController
{
    [Route]
    public HttpResponseMessage Get()
    {
        GCSettings.LargeObjectHeapCompactionMode = GCLargeObjectHeapCompactionMode.CompactOnce;
        GC.Collect(2);
        return Request.CreateResponse(HttpStatusCode.OK);
    }
}

This allows me to manually invoke a rude GC, and indeed, when running this, memory utilization dropped quite nicely. Of course, that isn’t something that you want to run into your systems, but it is very important diagnostic tool.

Next, I tried to do the following:

[Route]
public HttpResponseMessage Get()
{
    var file = File.ReadAllText(@"D:\5mb.json");
    var deserializeObject = JsonConvert.DeserializeObject<Item>(file);

    return this.Request.CreateResponse(HttpStatusCode.OK, new { deserializeObject.item, deserializeObject.children });
}

This involves no RavenDB code, but it has roughly the same memory pressure semantics as the customer code. Indeed, the problem reproduced quite nicely there as well.

So the issue is about a request that uses a lot of memory (include at least one big buffer), likely causing some fragmentation in the heap that would bring memory utilization high. When the system had had enough, it would reclaim all of that, but unless there is active memory pressure, I’m guessing that it would rather leave it like that until it has to pay that price.

time to read 3 min | 480 words

A customer called us to tell that they had a problem with RavenDB. As part of their process for handling new customers, they would create a new database, setup indexes, and then direct all the queries for that customer to that database.

Unfortunately, this system that has worked so well in development died a horrible death in production. But, and this was strange, only for new customers, and only in the create new customer stage. The problem was:

  • The user would create a new database in RavenDB. This just create a db record, and its location on disk. It doesn’t actually initialize a database.
  • On the first request, we initialize the db, creating it if needed. The first request will wait until this happens, then proceed.
  • On their production systems, that first request (which they used to create the indexes they require) would time out with an error.

Somehow, the creation of a new database would take way too long.

The first thought we had was they are creating the database on a path of an already existing database, maybe a big one that had a long initialization period, or maybe one that required recovery. But the customer validated that they were creating the database on an empty folder.

We looked at the logs, and the logs just showed a bunch of time were there was no activity. In fact, we had a single method call to open the database that took over 15 seconds to run. Except that on a new database, this method just create a bunch of files to start things out and is ready really quickly.

That is the point that led us to suspect that the issue was environmental. Luckily, as the result of many such calls, RavenDB comes with a pretty basic I/O Test tool. I asked the customer to run this on their production system, and I got the following:image

And now everything was clear. They were running on an I/O constrained system (a cloud machine), and they were running into an interesting problem. When RavenDB creates a database, it pre-allocate some files for its transactional journal.

Those files are 64MB in size, and the total write for a new Esent RavenDB database with default configuration is just over 65MB. If your write throughput is less than 1MB/sec sustained, that will be problematic.

I let the customer know about the configuration option to take less space at startup (Esent RavenDB databases can go as low as 5MB, Voron RavenDB starts at 256Kb), but I also gave them a hearty recommendation to make sure that their I/O rates improved, because this isn’t going to be the only case where slow I/O will kill them.

FUTURE POSTS

No future posts left, oh my!

RECENT SERIES

  1. Production postmorterm (2):
    11 Jun 2025 - The rookie server's untimely promotion
  2. Webinar (7):
    05 Jun 2025 - Think inside the database
  3. Recording (16):
    29 May 2025 - RavenDB's Upcoming Optimizations Deep Dive
  4. RavenDB News (2):
    02 May 2025 - May 2025
  5. Production Postmortem (52):
    07 Apr 2025 - The race condition in the interlock
View all series

Syndication

Main feed ... ...
Comments feed   ... ...
}